The PowerShares DB U.S. Dollar Index Bullish Fund (NYSEArca: UUP), which tracks the price movement of the U.S. dollar against a basket of currencies, including the euro, Japanese yen, British pound, Canadian dollar, Swedish krona and Swiss franc, gained nearly 3% and the U.S. Dollar Index’s tracking ETF’s upside may have more to come.
UUP and the dollar have modestly regained some momentum over the past two weeks, indicating that has market volatility continues to be an issue, the dollar’s safe-haven status could be reaffirmed.
A lack of inflation is also seen as a potential deterrent to the Fed imminently hiking rates. The diminished inflation expectations has bolstered demand for long-term maturities. The spread between two- and 30-year securities dipped for a fourth day after contracting to as little as 208 basis points Monday, the least since April 28, Bloomberg reports.
Long-term Treasuries have strengthened and yields dipped on the continued decline in oil prices helped push down inflationary pressures. Meanwhile, short-term Treasury yields have been anchored as speculators bet on a slow interest rate hike from the Federal Reserve. [Low Inflation Lifts ETFs]
“Longer-term bullish traders might consider waiting until the correction has played out before taking positions – an opportunity which could come during spring 2016. On the other hand, traders working with weekly and daily charts might watch the present area for support, with the expectation of a relatively quick bounce higher into areas near one of the targets shown on the US Dollar ETF chart, around $25.75 and $26.10,” according to See It Market.
The dollar got some added support last week when European Central Bank President Mario Draghi hinted at additional quantitative easing and the People’s Bank of China surprised global financial markets by lowering interest rates.
“If the Dollar ETF rallies as expected, it will be important for traders to monitor the charts for signs of exhaustion as price approaches the higher target areas. As always, the targets represent estimates of where the actual price might go. For readers who might have a great deal of experience with investing, but for whom the “trading mindset” is relatively new, we recommend studying the uses of common momentum indicators such as the Relative Strength Index (RSI) and the moving average convergence/divergence indicator (MACD) and watching for the divergence and crossover formations that commonly appear on those indicators when a price move is nearing its end,” adds See It Market.
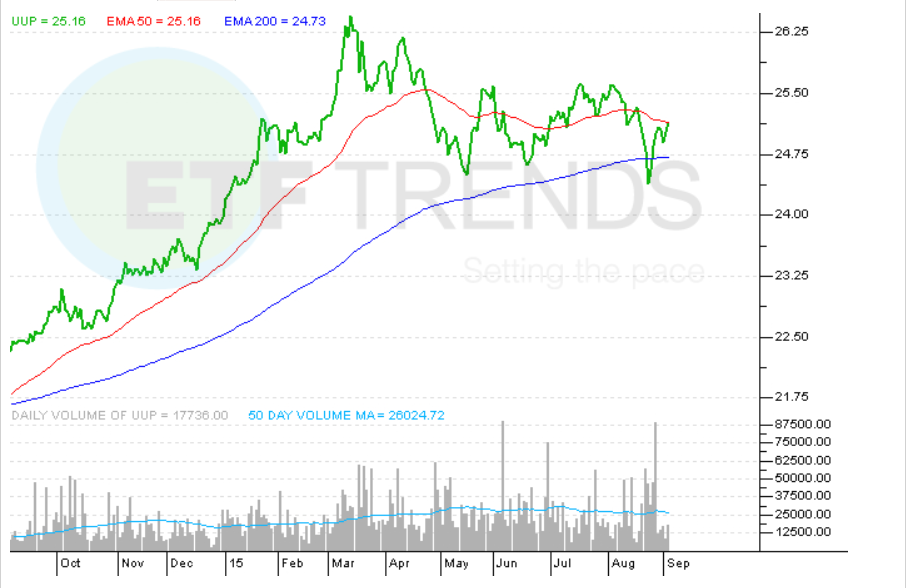
PowerShares DB U.S. Dollar Index Bullish Fund