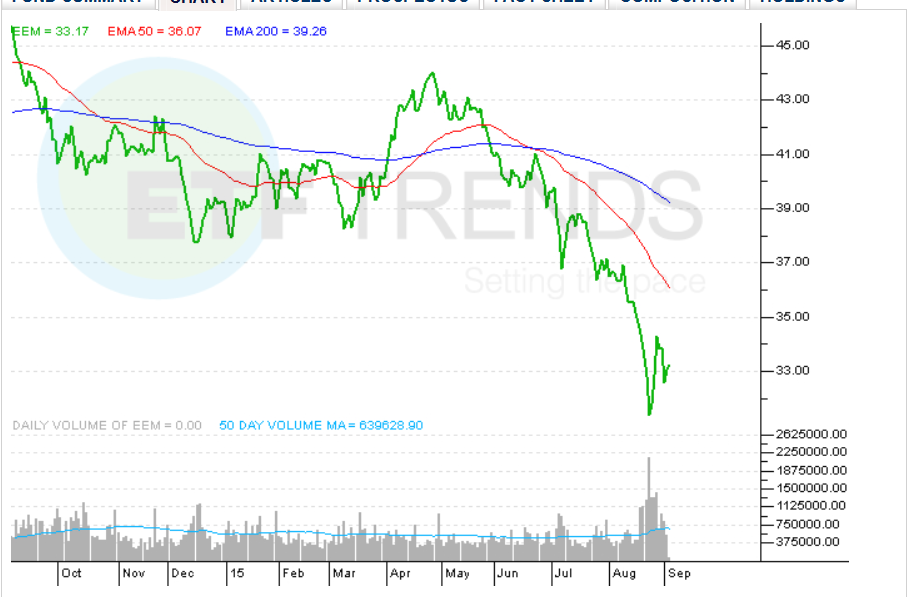
“Taking a look at the chart, you’ll notice that the price recently failed to break above the key resistance of its 50-day moving average. In technical analysis, it is not uncommon to see a bounce off of a key level of resistance and this level is used by many bearish traders for determining the placement of their stop-loss orders. To make matters worse for the bulls, you’ll also find that the 50-day moving average recently crossed below its 200-day moving average,” according to Investopedia.
According to a monthly fund manager survey from Bank of America Merrill Lynch, exposure to emerging market stocks remained at a record low, reports Dhara Ranasinghe for CNBC. EEM has a 11.3 P/E and a 1.3 P/B. In contrast, the S&P 500 is trading at a 17.5 P/E and a 2.4 P/B. [Emerging Markets ETFs Keep Bleeding Assets]
iShares MSCI Emerging Markets ETF
Tom Lydon’s clients own shares of EEM.