Down 5.4% year-to-date, the Materials Select Sector SPDR (NYSEArca: XLB) is already one of the worst performers among the nine sector SPDR exchange traded funds.
However, XLB and rival materials funds have given up gains notched earlier this year and witnessed accelerating losses in recent months. For example, XLB’s six-month loss is more than double its year-to-date swoon.
Rising Treasury yields, a sign that the Federal Reserve could be close to finally raising borrowing costs and that is good news for cyclical sectors. The technology, industrial and materials companies are among cyclical sectors that typically strengthen in a rising rate environment as investors turn away from safer assets and shift into riskier areas of the market. [Materials ETFs in Rally Mode]
But late-cycle ebullience has retired as investors have grown wary of sluggish materials and industrial ETFs. Now, some technical analysts see more downside brewing for XLB and the materials sector.
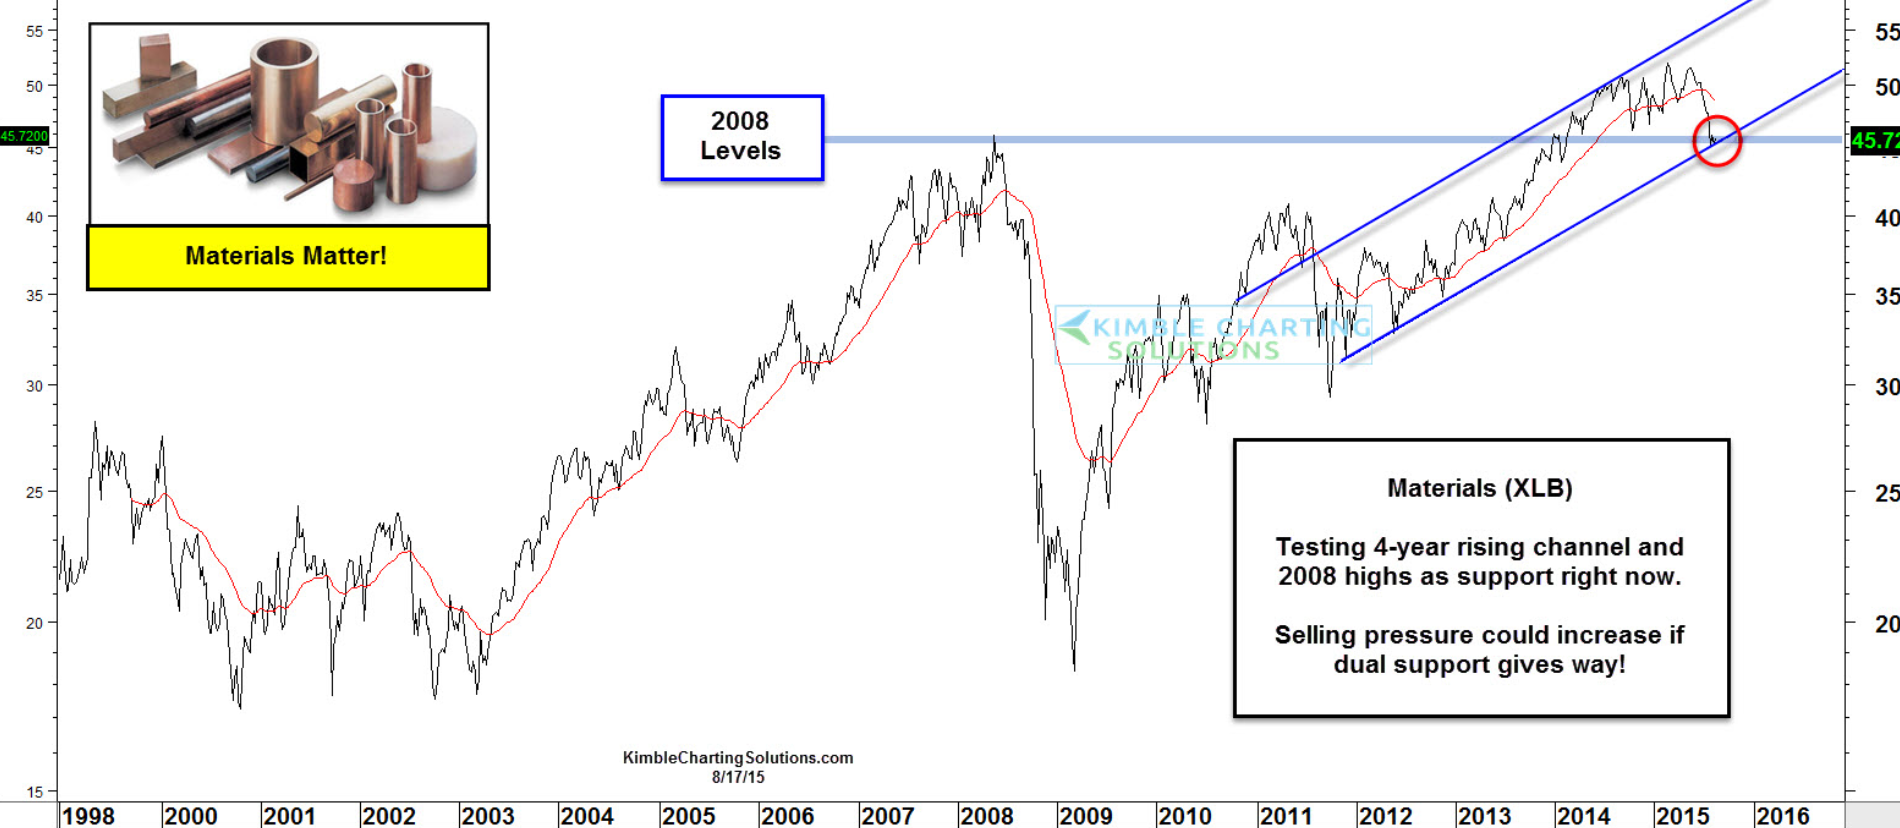
“As you can see XLB is testing dual support right now and it is below its 200 Day moving average.
Even though this sector has been weak of late and this year, if dual support gives way, selling pressure could ramp up. Humbly I feel what materials do from here matters from a micro and big picture perspective. What could do well if XLB breaks support? Bonds could be a beneficiary should it happen,” notes Chris Kimble of Kimble Charting Solutions.
Although XLB has been mostly flat this month, seasonal factors could conspire against the largest materials ETF. XLB is usually the second-worst of the nine SPDRs in August and things do not get any better in September as XLB is historically the worst sector SPDR in the ninth month of the year. [Sector ETF Ideas for August]
XLB and other materials ETFs have also been hampered by investors preferring low volatility sectors over higher beta fare. Materials stocks reside in the latter category.
Beta is a common measure of volatility, or systematic risk, of a security or portfolio, compared to the broader marketplace. A beta reading above 1 indicates that the security is more volatile than broader equities market, whereas a beta of less than 1 corresponds to lower volatility. Potential investors should know that a higher beta may generate greater returns at greater risks while low-beta securities are considered a more conservative play.
Chart Courtesy: Kimble Charting Solutions