When it comes to inexpensive, highly liquid exchange traded funds offering broad exposure to U.S. stocks, investors have plenty of options.
The Shares Core S&P Total US Stock Market ETF (NYSEArca: ITOT), part of the iShares core series of ETFs aimed at cost-conscious investors, is an idea to consider for broad U.S. equity exposure. ITOT, which has $2.42 billion in assets under management, tracks the S&P Composite 1500, but there are important differences between this ETF and rivals, such as the Vanguard Total Stock Market ETF (NYSEArca: VTI) and the Schwab U.S. Broad Market ETF (NYSEArca: SCHB).
“The S&P 1500 Index that this fund tracks does not include as many small- or micro-cap stocks as other U.S. broad or total stocks market indexes from Russell or CRSP. This less comprehensive coverage may slightly reduce the fund’s diversification and return potential. However, these omitted stocks should have only a limited impact because of their small total size in any market-cap-weighted index. Additionally, the S&P index committee applies some screens that make certain unprofitable companies ineligible for addition to its indexes. Despite their differences, broad stock market indexes tend to be highly correlated and have had similar long-term performance,” according to new research note from Morningstar.
VTI tracks the CRSP U.S. Total Market Index, which includes almost every liquid U.S. stock on the market. The ETF covers 3,818 components. [The Total Cost of Investing in ETFs]
SCHB, on the other hand, follows the Dow Jones U.S. Broad Stock Market Index, which tracks about 95% of the U.S. equity market, including 2,002 companies. However, SCHB does not include exposure to micro-caps, which VTI does. By comparison, ITOT holds 1,504 stocks. ITOT charges 0.07% per year, slightly more than the 0.05% and 0.04% charged by VTI and SCHB. [Build a Dirt-Cheap Portfolio With These ETFs]
“Although it reaches further down the market-cap ladder, the S&P 1500 had more than a 0.99 correlation to the S&P 500 during the past decade. Despite this high correlation, the S&P 1500 returned an annualized 7.89% during that time period, while the S&P 500 returned 7.67%. Strong returns of smaller stocks helped drive this superior performance. It accomplished this higher return with only slightly greater volatility (standard deviation of 15.0%) than the S&P 500 (14.7%),” said Morningstar of ITOT.
ITOT allocates 19.5% of its weight to technology stocks and 17.3% to financial services names. The healthcare sector commands nearly 15% of the ETF’s weight followed by consumer staples at 12.9%. Eight of ITOT’s top 10 holdings, a group that combines for 15.4% of the ETF’s weight, are Dow components with Wells Fargo (NYSE: WFC) and Berkshire Hathaway (NYSE: BRK-B) the outliers. ITOT has more than doubled in size over the past 26 months.
ITOT’s three-year standard deviation is 8.52% with a beta of 1.01, according to iShares data.
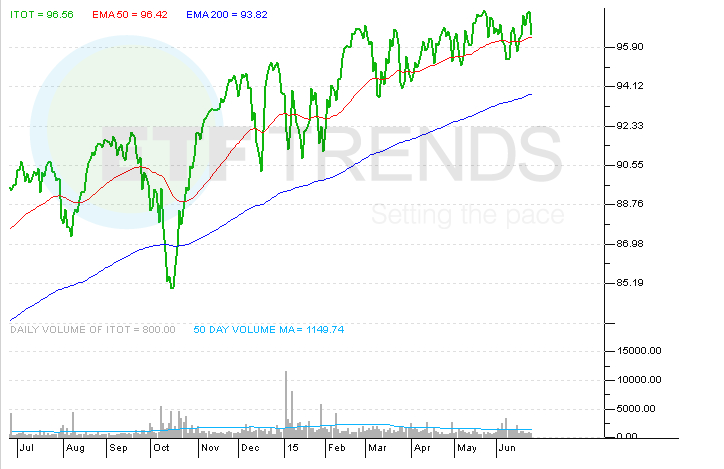
iShares Core S&P Total US Stock Market ETF