“Although it reaches further down the market-cap ladder, the S&P 1500 had more than a 0.99 correlation to the S&P 500 during the past decade. Despite this high correlation, the S&P 1500 returned an annualized 7.89% during that time period, while the S&P 500 returned 7.67%. Strong returns of smaller stocks helped drive this superior performance. It accomplished this higher return with only slightly greater volatility (standard deviation of 15.0%) than the S&P 500 (14.7%),” said Morningstar of ITOT.
ITOT allocates 19.5% of its weight to technology stocks and 17.3% to financial services names. The healthcare sector commands nearly 15% of the ETF’s weight followed by consumer staples at 12.9%. Eight of ITOT’s top 10 holdings, a group that combines for 15.4% of the ETF’s weight, are Dow components with Wells Fargo (NYSE: WFC) and Berkshire Hathaway (NYSE: BRK-B) the outliers. ITOT has more than doubled in size over the past 26 months.
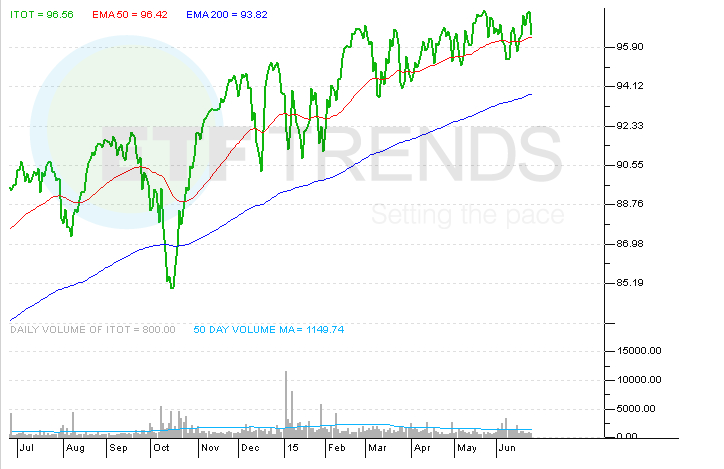
ITOT’s three-year standard deviation is 8.52% with a beta of 1.01, according to iShares data.
iShares Core S&P Total US Stock Market ETF