It would seem to be logical, oil prices go up and energy equities and the corresponding exchange traded funds follow suit. At least that is the view of some market observers.
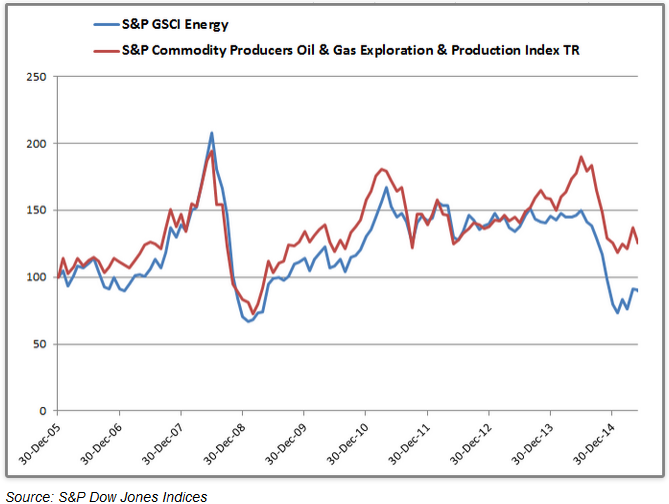
“Of course, energy futures and oil and gas producing stocks, are related as evident in the chart below, but it may not be as much as expected. The correlation is 0.79 between the S&P GSCI Energy and S&P Commodity Producers Oil & Gas Exploration & Production Index TR, using monthly data from Dec 30, 2005 – May 29, 2015. There are influences on stocks of producers that may not be related to the oil price but aim to maximize shareholder value. For example, decisions on dividends, debt/equity ratios or even hedging out the price of oil may drive the stock price independently from the underlying oil price,” writes Jodie Gunzberg, global head of commodities, S&P Down Jones Indices.
Likewise, energy stocks can post gain even as crude futures dither. For example, the United States Oil Fund (NYSEArca: USO), which tracks West Texas Intermediate crude oil futures, is off almost 38% over the past three years. However, the Energy Select Sector SPDR (NYSEArca: XLE) and the SPDR S&P Oil & Gas Exploration & Production ETF (NYSEArca: XOP) are up 32.2% and 12.7%, respectively, over that period. [Returning to Energy ETFs]
The $1.63 billion XOP tracks the aforementioned S&P Oil & Gas Exploration & Production Select Industry Index and the ETF is believed to have an intimate correlation to oil prices. However, XOP has outpaced USO every year since 2009 and on several occasions, the margins have not been close. For example, in 2010, XOP climbed 28.6% while USO finished the year slightly lower. [E&P ETF hit by Poor Wall Street Outlook]
Energy stocks often prove less bad than oil futures when the latter decline, but the rub with that scenario is that oil’s rebound does not equal dollar-for-dollar gains in energy equities.
“The annualized volatility of the stocks of producers is basically the same as the futures at 28% versus 29% but for every 1% move in oil futures (up or down), the stocks only move 74 basis points as measured by beta. What is more interesting to study is how oil stocks perform versus oil futures in up and down markets. On average in a down month for oil, futures drop 6.8% versus only 4.9% for the stocks; however, when oil rises, futures rise 6.1% on average in a month but stocks only rise 4.9%,” according to Gunzberg.
Despite oil’s struggles, investors have displayed an affinity for energy ETFs this year. USO has added $821.5 million in new assets while XOP has hauled in $548.6 million in fresh investments. XLE has seen $1.55 billion of inflows.
Chart Courtesy: S&P Dow Jones Indices.