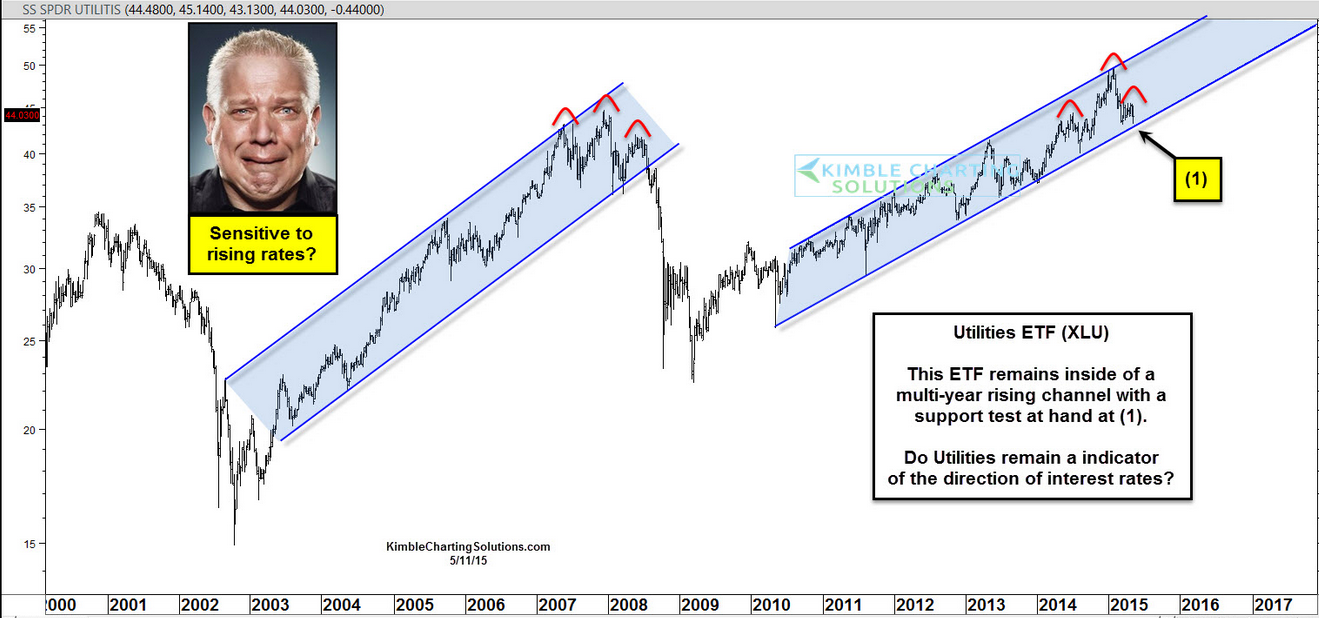
“Over the past few years, XLU has done well, inside of a rising channel? Is XLU forming a Head & Shoulders topping formation again? It would appear its a little soon to tell on the pattern. For sure XLU is nearing the bottom of its multi-year rising channel. A break of support could bring in some sellers of the ETF,” said Kimble.
Some investors are not waiting around to see what happens next. XLU has lost almost $387 million since the start of the current quarter while the iShares 20+ Year Treasury Bond ETF (NYSEArca: TLT) has lost $580.5 million, indicating some investors are convinced rising rates are imminent.
Utilities Select Sector SPDR
Chart Courtesy: Kimble Charting Solutions
Tom Lydon’s clients own shares of TLT.