One of Wednesday’s bigger stories from the world of exchange traded funds was the carnage in the solar space.
By the time the closing bell rang, the Guggenheim Solar ETF (NYSEArca: TAN) and the Market Vectors Solar Energy ETF (NYSEArca: KWT) finished the day lower by 7.8% and 6.8%, respectively, making the pair the two worst-performing non-leveraged ETFs on the day.
The culprit for the solar ETFs’ woes is Hanergy Thin Film Power Group, shares of which plunged 47% in Hong Kong trading before trading was halted in the stock. Controversy has been swirling around Hanergy, including the fact that its closely held parent company accounted for nearly two-thirds of last year’s revenue. [Reason for Caution With Solar ETFs]
Wednesday’s declines at the hands of Hanergy Thin Film and previous declines caused by t he realization that Yingli Green Energy (NYSE: YGE), the world’s second-largest solar manufacturer by shipments in 2014, may not be in business much longer have exposed some technical weakness for TAN, the largest of the two solar ETFs. [Hanergy Punishes Solar ETFs]
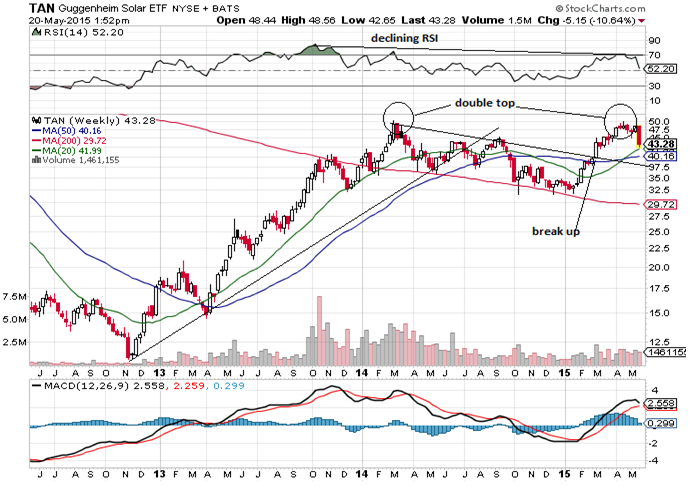
Regarding TAN’s technical state of affair’s Street One Financial market technician David Chojnacki had the following to say: “Back in March of 2014 it hit a weekly high(near 50), but several months later, in July of 2014, broke a year and a half uptrend-line. It continued in a downward trend until breaking that downtrend in March of 2015. Recently in April of 2015, it matched the March 2014 high of 50, developing a double top.”
TAN’s technical weakness belies some positive fundamentals.
“Solar stocks surged during the first quarter of 2015 on bullish factors including (1) broadly positive Q4 earnings news across the solar sector and positive guidance for 2015, (2) announcements by more solar companies that plan to form yieldcos, (3) indications of strong world solar demand that has solar companies running at high utilization rates and planning more capacity, (4) news that China boosted its 2015 PV installation target by 19% to 17.8 GW from the preliminary figure of 15 GW, (5) the stabilization of crude oil prices and the broader realization that crude oil prices and solar stocks have little connection, and (6) heavy short-covering,” according to a research note from MAC Global Solar Energy Index, the index provider for TAN’s underlying benchmark.
Still, the near-term technical outlook for TAN is ominous. At least that is Chojnacki’s take.
“The pullback since the high, has precipitated recently by the fall of the two companies mentioned at the top. With a declining RSI and a MACD turning to the downside, we need to look for the next obvious support levels of the 20 and 50 week moving averages(see chart). If Tan cannot hold those levels it may be setting up for a 20 % correction from its recent high, putting it near 40,” he said.
Guggenheim Solar ETF
Chart Courtesy: David Chojnacki , Street One Financial