It has been more than 20 years since the first U.S.-listed exchange traded started trading, but a familiar conundrum facing ETF investors remains. Scores of ETFs have similar-sounding names that imply the funds are carbon copies of each other when that is not the case.
“ETFs own baskets of securities that are designed to track the performance of a certain market index. Some of these funds might seem similar—because they focus on the same market area or have similar-sounding names—but the indexes they follow may be quite different, meaning the funds often produce divergent results,” reports Michael Pollock for the Wall Street Journal.
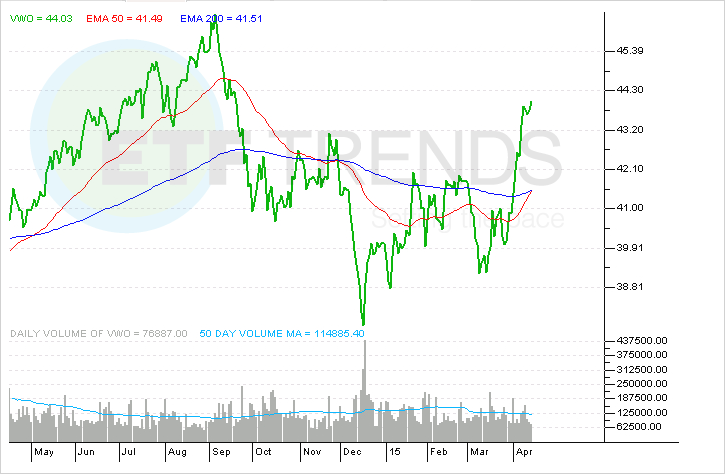
As the Journal points out, one of the most familiar examples of two ETFs that have similar names but deliver diverging returns is the comparison of the Vanguard FTSE Emerging Markets ETF (NYSEArca: VWO), which tracks the FTSE Emerging Index, and the iShares MSCI Emerging Markets ETF (NYSEArca: EEM), which follows the MSCI Emerging Markets Index. [Emerging Markets ETF Ideas]
Until late 2012, VWO and EEM both tracked the MSCI Emerging Markets Index, but by mid-2013, VWO was using the FTSE Emerging Markets Index as its benchmark. FTSE classifies South Korea as a developed market while rival MSCI still views Asia’s fourth-largest economy as a developing market. Translation: EEM holds South Korean stocks, VWO does not.
While VWO and EEM have deviated much from each other this year, longer periods show a significant difference between the two ETFs. For example, VWO has traded slightly higher over the past two years while EEM is off half a percent over that period. [Emerging Markets ETFs Show Leadership Traits]
“Indeed, Morningstar Inc. classifies the iShares fund’s portfolio as 31% developed markets and 69% emerging markets. The research firm puts the Vanguard fund’s holdings at 17% developed and 83% emerging,” according to the Journal.
Another familiar similar-name-different-results scenario arrives courtesy of the PowerShares S&P 500 Low Volatility Portfolio (NYSEArca: SPLV) and the iShares MSCI USA Minimum Volatility ETF (NYSEArca: USMV).
Both ETFs promise investors reduced volatility, but the funds deliver on that promise in varying fashion. For example, SPLV holds the 100 S&P 500 stocks with the lowest trailing 12-month volatility. USMV takes into account variance, correlation and sensitivities to risk factors. [ETFs for the Low Vol Anomaly]
Over the past 12, 24 and 36 months, SPLV and USMV have delivered noticeably different returns, the result of wildly different sector weights. For example, USMV has a 20% weight to healthcare stocks, but that sector is just 9% of SPLV’s weight. On the other hand, SPLV has a 36.3% weight to the financial services sector, a group USMV devotes 15.6% to.
Vanguard FTSE Emerging Markets ETF
Tom Lydon’s clients own shares of EEM.