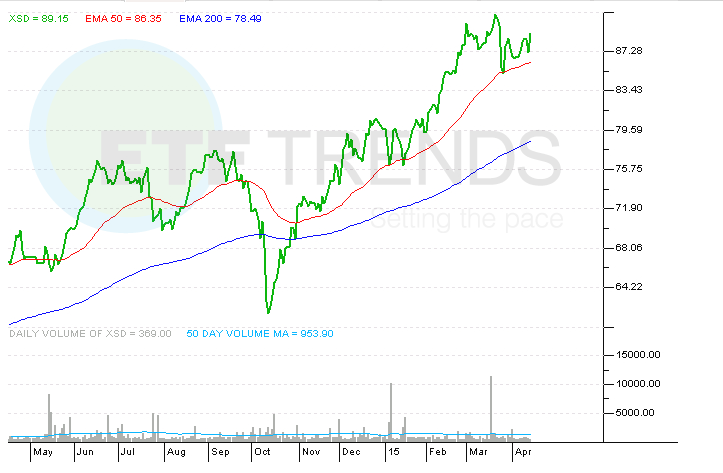
For example, the $179 million SPDR S&P Semiconductor ETF (NYSEArca: XSD), an equal-weight ETF, has a 5% combined weight to Intel and Micron. Qualcomm and SanDisk are not XSD holdings. Those differences between XSD and SOXX are palpable in terms of returns as XSD has surged 10% this year. XSD is higher by 29% over the past year, an advantage of more than 1,000 basis points over XSD. [A Surprising Lead Among Tech ETFs]
The PowerShares Dynamic Semiconductors Portfolio (NYSEArca: PSI), the smallest of the ETFs mentioned here with $82.2 million in assets under management, is higher by 5.7% this year. PSI tracks the Dynamic Semiconductor Intellidex Index, which evaluates companies for inclusion based on “price momentum, earnings momentum, quality, management action, and value, according to PowerShares.
That indexing methodology means PSI allocates just over 9% of its combined weight Intel and Micron, but like XSD, PSI holds not Qualcomm or SanDisk. Up 31% over the past year, the PowerShares offering is the top-performing non-leveraged semiconductor ETF over that time. PSI was also the best non-leveraged technology ETF in 2014. [This Year’s top Tech ETF]
SPDR S&P Semiconductor ETF