Guess this year’s top-performing non-leveraged exchange traded fund. Think it is a niche play like the Guggenheim Solar ETF (NYSEArca: TAN) or maybe a high-flying currency hedged fund? Perhaps a biotechnology ETF?
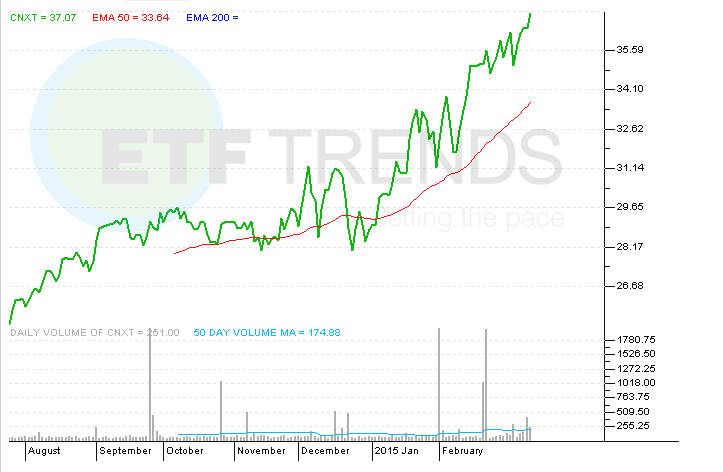
All of those are good guesses, but they are all wrong. To this point in 2015, the best-performing non-leveraged ETF is the Market Vectors ChinaAMC SME-ChiNext ETF (NYSEArca: CNXT), which after touching another all-time high Monday is up nearly 35% this year. The ETF debuted last July.
CNXT follows the SME-ChiNext 100, which provides exposure to the 100 most liquid mid- and small-cap stocks that trade on the Small and Medium Enterprise (SME) Board and the ChiNext Board of the Shenzhen Stock Exchange (SZSE). [Smaller China ETFs are Surging]
The SME Board is viewed as China’s NASDAQ. CNXT is an A-shares ETF, meaning it tracks stocks listed in Shanghai and Shenzhen. That also means the fund competes in a corner of the ETF space that was once thinly populated, but has boomed over the past two years. CNXT holdings are helping set the fund apart from rivals and the impact is being felt in terms of 2015 performance.
“The types of companies represented in CNXT (80%+ non-government owned companies trading on the SME and ChiNext Boards) have a different profile from the standard mid- to small-caps represented by the CSI 500 Index (which is 46% SOEs) and the large-caps of the CSI 300 (which is 56% SOEs),” according to Market Vectors.
“In addition, companies in the SME-Chinext 100 Index have historically demonstrated high return on equity (ROE) compared to the CSI 500 Index, generally regarded as a small-cap A-share benchmark,” notes Market Vectors.
In 2014, the average return on equity for SME-Chinext 100 member firms was nearly 500 basis points higher than that of CSI 500 equivalents.
Although much has been made of the struggles of select Chinese Internet stocks, namely Alibaba (NYSE: BABA), the technology and consumer discretionary sectors have been important drivers of CNXT’s strong 2015 showing. Those sectors have combined to drive over a third of CNXT’s year-to-date gain, according to Morningstar data. The ETF allocates a combined 48.7% of its weight to technology and discretionary names. [Consider These New China ETFs]
A-shares equities have become pricier than their Hong Kong-listed counterparts, a trait reflected by CNXT’s 40.6 trailing P/E. What investors are paying up is as important as knowing that they are paying up in the first place. With small-caps, that means growth and A-shares small-caps deliver that. SMEs in China currently contribute 50% of national tax revenue, 60% of GDP, 74% of technical innovation, and 80% of employment, according to Market Vectors data.
Market Vectors ChinaAMC SME-ChiNext ETF