The high yield market has had a positive correlation with equity markets for many years when comparing the percentage change in spreads (over Treasuries) for key high yield indices vs. the percentage change in level for equities, and this correlation has become even more pronounced since the global financial crisis.
According to PIMCO, equity market volatility and its associated effects on enterprise value have driven high yield spreads. The investment implications of the equity–high yield correlation say that if you expect equity valuations to increase for a certain sector or name – whether based on general growth prospects, a changing environment or new information – then, all else being equal, you could expect credit spreads in that sector or name to decrease in the future. For example, spreads on credits related to metals and mining sectors widened in 2012 from relatively weak equity performance in the sector, mainly due to decreased demand from China.
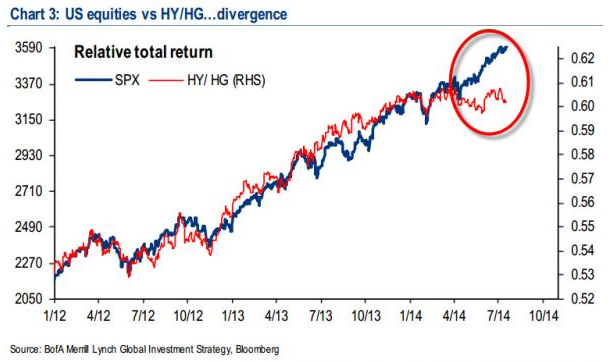
Even if stocks hold up in war times, it is possible investors will flee high yield bonds first since they may not feel they are getting compensated to take the geopolitical risk. As zerohedge.com points out, “geopolitical risk is causing a pause… Investors tend to flee riskier assets during times of turmoil.” This may cause a decoupling of high yield from stocks as seen in the chart below:
So if oil is the choice for hedging against geopolitical risk, then what type of strategy performs best? That depends on whether the term structure is backwardated or in contango. When backwardation is prevalent, the front month contracts have outperformed, and when contango is predominant, the forward months have performed better. From 2004-2011, contango dominated but in 2013 that changed. However, it takes time to move from one persistent term structure to the next given inventories can be slow moving in either direction. It can take some time for inventories to be drawn down and also may be difficult to replenish. This is similar in energy as it is in other commodities that are difficult to store, like agriculture.
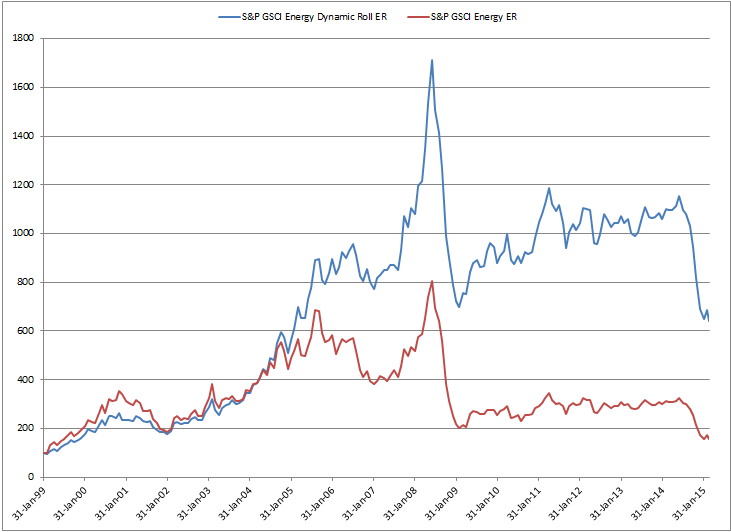
Below is a chart and table demonstrating the long term gain by using a dynamic roll strategy in energy. The sector is comprised roughly of 35% each WTI and Brent, 10% gasoil, 7.5% each of heating oil and unleaded gasoline, and 5% natural gas. Overall the annualized return since inception in 1999 is 12.7% for the S&P GSCI Energy Dynamic Roll and 3.5% for the S&P GSCI Energy.
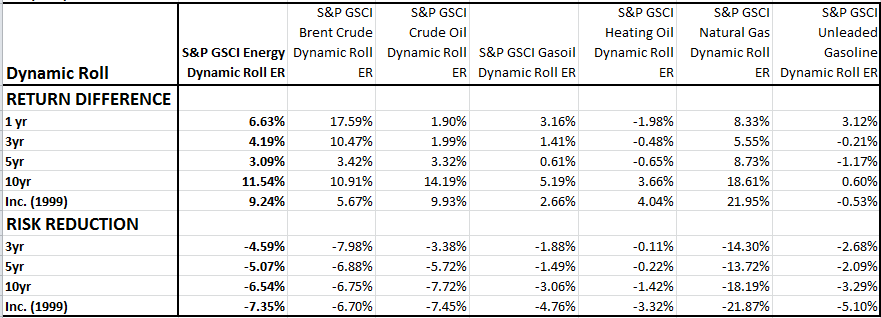
Certain commodities are more sensitive to the term structure that you can see below in the table. For example, heating oil and unleaded gasoline have front contracts that have outperformed later dated, more flexible strategies. As oil gets cheaper, the price for refined oil like heating oil and unleaded gasoline may drop, causing demand to increase and inventories to fall.
Source: S&P Dow Jones Indices. Past performance is not an indication of future results.
This article was written by Jodie Gunzberg, global head of commodities, S&P Down Jones Indices.
© S&P Dow Jones Indices LLC 2013. Indexology® is a trademark of S&P Dow Jones Indices LLC (SPDJI). S&P® is a trademark of Standard & Poor’s Financial Services LLC and Dow Jones® is a trademark of Dow Jones Trademark Holdings LLC, and those marks have been licensed to SPDJI. This material is reproduced with the prior written consent of SPDJI. For more information on SPDJI, visit http://www.spdji.com