With the Russell 2000, the benchmark small-cap index, up 2.4% this year, investors are again warming to smaller stocks. Strength in small-caps also gives investors the opportunity to examine small-cap exchange traded ETFs because what appear to be slight differences on the surface can be meaningful when it comes to returns.
That is true even of the multiple ETFs that track the Russell 2000 because some ETFs are less expensive than others while some feature superior liquidity, which can help reduce costs. The iShares Russell 2000 ETF (NYSEArca: IWM) is the largest small-cap ETF, but it is more expensive than its rivals, the SPDR Russell 2000 ETF (NYSEArca: TWOK) and the Vanguard Russell 2000 ETF (NYSEArca: VTWO). [Small-Cap ETFs Look to Rally]
“IWM has a 0.20% expense ratio — higher than TWOK’s 0.12% or VTWO’s 0.15%. However, helped by its stronger average daily volume of 31 million shares, IWM’s bid/ask spread of a $0.01 is much lower than VTWO’s $0.07 and TWOK’s $0.11, erasing most or the entire expense ratio differential,” said S&P Capital IQ in a new research note.
S&P Capital IQ rates IWM, TWOK and VTWO overweight.
More attractive valuations in small company stocks relative to their larger counterparts and the U.S. growth outlook are helping small-cap exchange traded funds reach new highs. Small-cap valuations now look more attractive, with the S&P 600 trading at about 20.3 times 2015 earnings, below the trailing 20-year average and about 7 points below the level at the start of 2014. [Small-Cap ETFs Become Leaders]
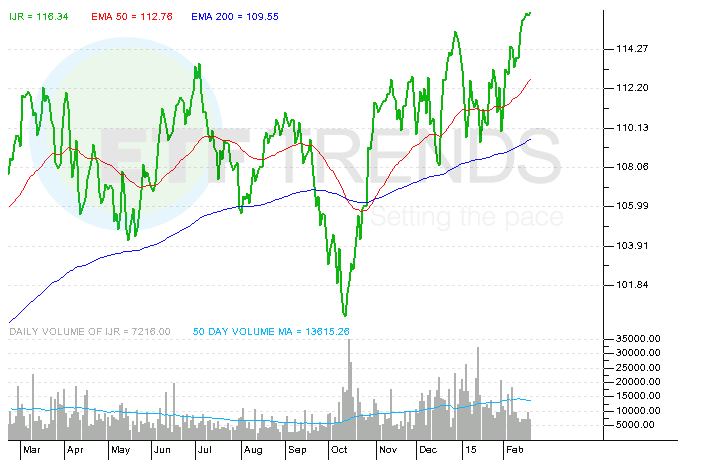
Several ETFs offer exposure to the S&P 600 SmallCap Index, including the iShares Core S&P Small-Cap ETF (NYSEArca: IJR) and the SPDR S&P 600 Small Cap ETF (NYSEArca: SLY).
“In the three-year period ended February 20, IJR’s 16.7% annualized return was 100 basis points ahead of IWM. Past performance is not indicative of future results and S&P Capital IQ cautions investors from choosing one ETF based solely on its past record. S&P Capital IQ ETF reports and rankings incorporate not only performance, but also costs, risks, and the likely future prospects of underlying holdings,” said S&P Capital IQ.
IJR is a member of the growing iShares core lineup aimed at cost-conscious investors. The ETF charges 0.12%, which is toward the lower end of the expense ratios found on small-cap funds. SLY charges 0.15% per year. [Return of Small-Cap ETFs]
Sector considerations are also important when evaluating small-cap ETFs. For example, IWM allocates 23.6% of its weight to financials and 17.8% to technology names. The health care and consumer discretionary sectors combine for 29.5% of the ETF’s weight.
IJR’s financial services weight is comparable to IWM’s at 23.2%, but the former’s tech is 16.9%. Discretionary and health care combine for 27.4% of IJR’s weight.
“These allocations have, in our view, impacted performance. IWM has a higher three-year standard deviation of 13.0 and beta vs. the S&P 500 Index of 1.17 than IJR (12.3 and 1.2). Looking at recent calendar years, IWM underperformed IJR by 269 basis points in 2013, but outperformed by 70 basis points in 2012,” according to S&P Capital IQ.
iShares Core S&P Small-Cap ETF
Tom Lydon’s clients own shares of IWM.