The bull market in U.S. stocks is approaching its sixth anniversary and the move to record highs has been great news for scores of broad market and sector exchange traded funds.
The bull market has also made it easier to identify laggard sectors and the corresponding ETFs. One of the more egregious laggards has been the Market Vectors Agribusiness ETF (NYSEArca: MOO), a once beloved ETF.
MOO debuted in August 2007, meaning it was able to participate in the latter stages of the commodity boom that lifted fertilizer stocks to stratospheric heights. Remember the halcyon days when Potash Corp. of Saskatchewan (NYSE: POT), currently MOO’s fourth-largest holding at a weight of 6.5%, had a market cap that rivaled that of McDonald’s (NYSE: MCD). Few investors do and it is several years of disappointment by fertilizer stocks that highlights investors’ dissatisfaction with MOO. [Commodity ETFs Slump]
Since the bull market started in March 2009, MOO has only outperformed the S&P 500 twice on an annual basis. Those instances occurred in 2009 and 2010. Over the past three years, the agribusiness ETF is up just 14.1% compared to a 66% gain for the S&P 500.
Fast-forward to 2015 and it looks like MOO is finally shaking its laggard status. The ETF is up nearly 6% year-to-date, a gain that is almost triple that of the S&P 500 and slightly ahead of theMaterials Select Sector SPDR (NYSEArca: XLB). [Late Cycle ETFs Spring to Life
As independent trader Larry Tentarelli notes, MOO is breaking out of a lengthy, multi-year base and flirting with its 2008 highs.
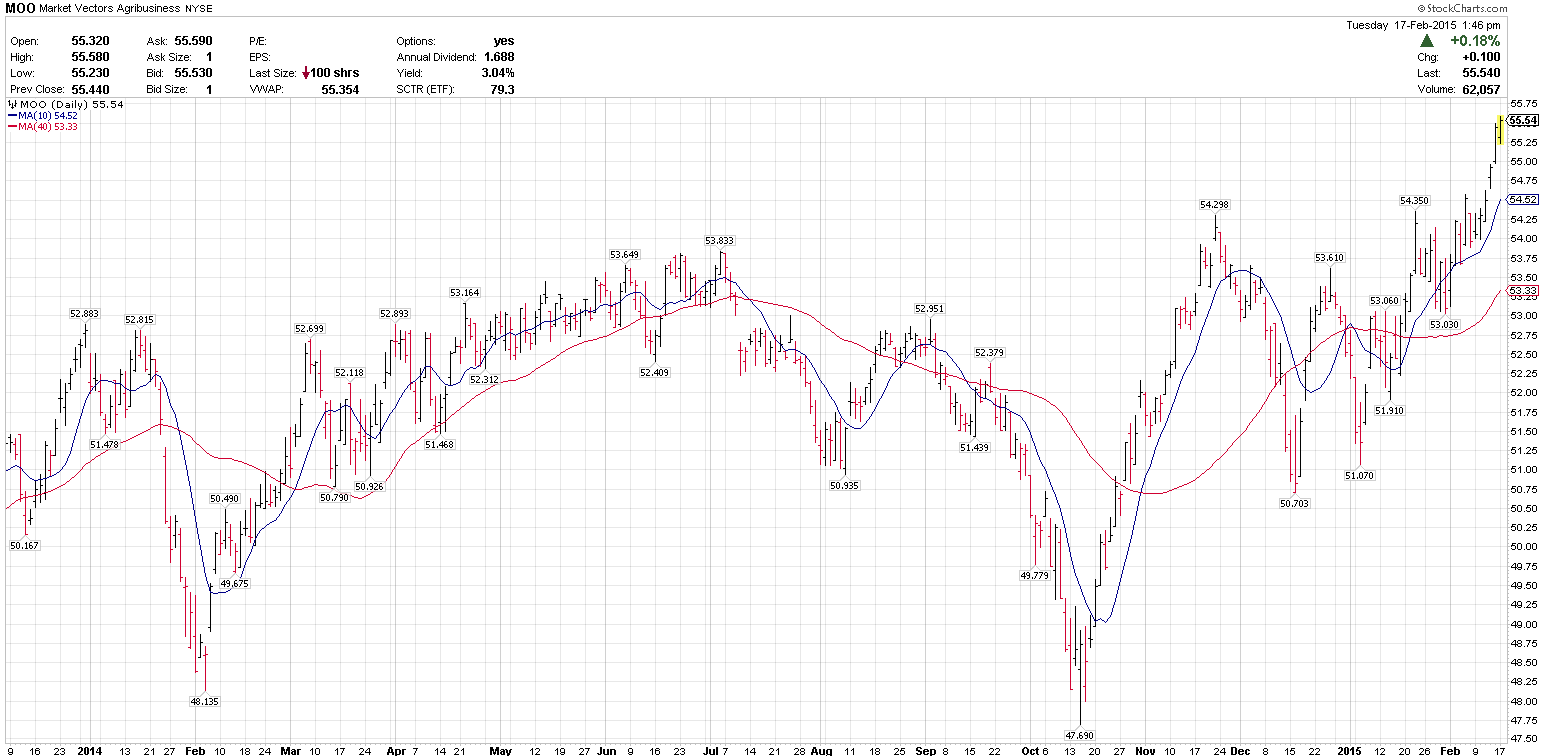
Chart Courtesy: Larry Tentarelli
Importantly, MOO’s marquee names are leading the ETF higher. Syngenta (NYSE: SYT) and CF Industries (NYSE: CF) are up an average 9.1% this year while the latter is also flirting with record highs. Nine of MOO’s top 10 holdings have traded higher this year, led by Agrium (NYSE: AGU) and Mosaic (NYSE: MOS), each of which are up roughly 14%. Agrium, Mosaic and CF Industries combine for about 12% of MOO’s weight.
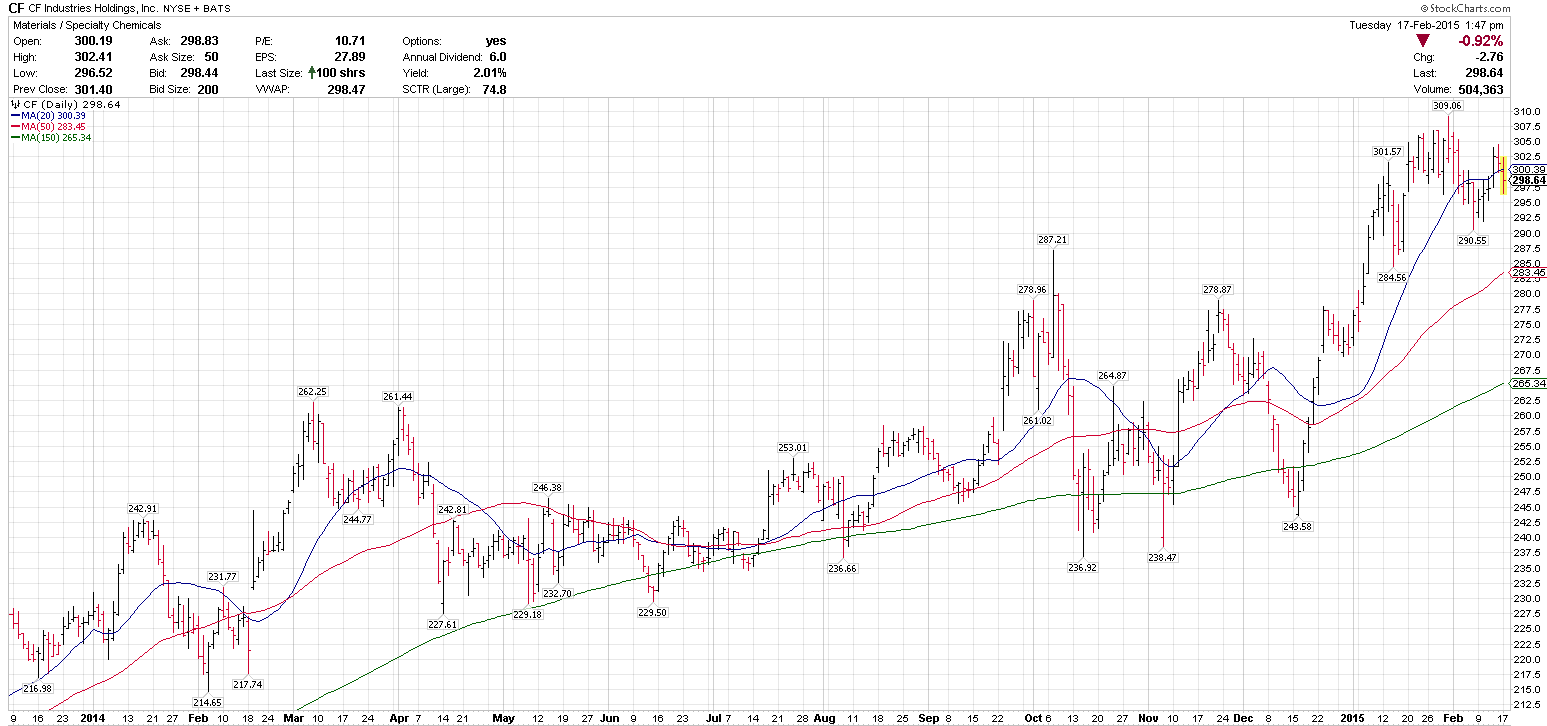
Chart Courtesy: Larry Tentarelli
MOO tells another story investors should listen to: ETF flows data is not always an accurate harbinger of that fund’s future performance.
There was a time when MOO was the largest Market Vectors ETF. After losing nearly $3.1 billion in assets last year, a total exceeded by just three other ETFs, MOO is now a $1.5 billion ETF. Call it capitulation or frustration-induced selling. Either could be accurate, but what was not accurate were those outflows indicating more pain for MOO because the opposite has been true to this point in 2015.