It has become a prominent theme in the U.S. high-yield bond market this year. That being the vulnerability of junk bonds to plunging oil prices.
Eager to tap North American shale plays from the Eagle Ford in South Texas to North Dakota’s Bakken Shale and a host of others, mid-level and smaller exploration and production companies have become some of the most prolific issuers of U.S. junk bonds in recent years.
Energy exposure in marquee high-yield indexes has increased so much in recent years that energy issuers now occupy the largest sector weights in those indexes, making the SPDR Barclays High Yield Bond ETF (NYSEArca: JNK) and the iShares iBoxx $ High Yield Corporate Bond ETF (NYSEArca: HYG) predictable victims of oil’s slide. [Lower Duration, Lower Energy Exposure]
Over the past three months, HYG and JNK, the two largest junk bond ETFs, are off an average of 4.8%. That is far better than the 39% slide for the United States Oil Fund (NYSEArca: USO) over the same period, but enough for investors to be reminded that the 13.2% oil and gas exposure found in HYG and the roughly 17% energy sector exposure found in JNK makes the ETFs vulnerable to falling oil prices and rising default speculation.
In recent days, HYG and JNK have been decoupling from USO with the junk bond ETFs each rising 2% over the past week while the oil fund has slid 6%. That scenario combined with some encouraging signs on junk bond ETF charts could portend more near-term upside for HYG and JNK.
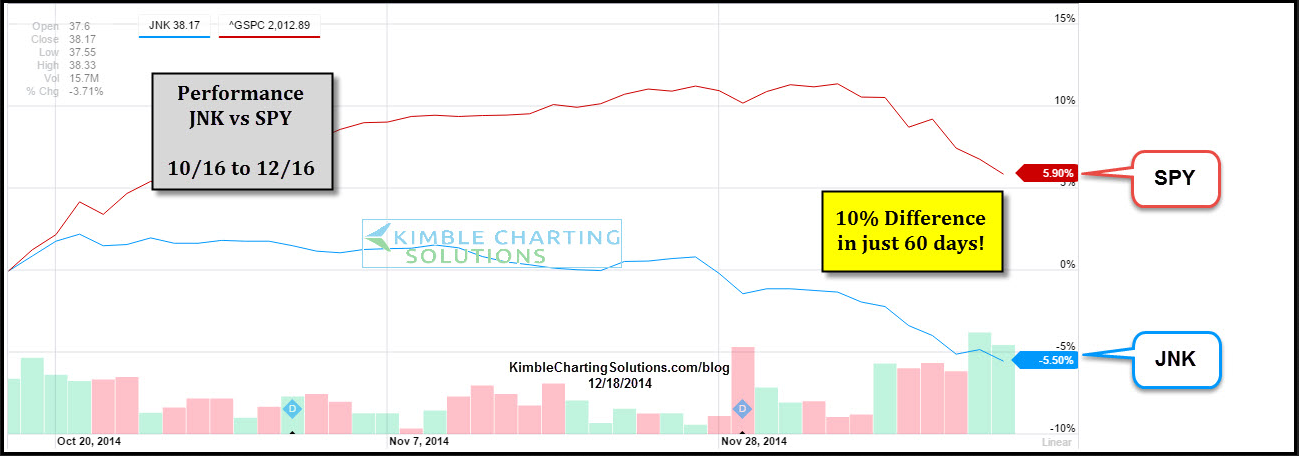
“If one likes the idea of buying low and selling higher, junk bonds might come to mind due to how hard they’ve been hit of late! The chart below highlights that an unusual and large performance spread between JNK and the S&P 500. Its not often that these two see a 10% return difference in just 60 days. This differential wasn’t the only thing that got my attention though,” said Chris Kimble of Kimble Charting Solutions.
Kimble goes on to note that “At the same time junk was doing so poorly, the decline took both JNK & HYG down to levels not seen since 2012 and momentum is the most oversold in the past 5 years.”
Interestingly, oil’s decline has not chased investors from junk bond ETFs. Since the start of the fourth quarter, HYG and JNK have added $1.77 billion and $884 million in new assets, respectively. However, the two ETFs have endured modest outflows since the start of this month. [What ETF Assets are Cheap and Too Rich]
Chart Courtesy: Kimble Charting Solutions
Tom Lydon’s clients own shares of HYG and JNK.