Many market observers and pundits have been saying for a while now that the U.S. equity market is the place to be. Returns prove as much.
Though Tuesday was just one day, forty-one of the 105 exchange traded funds that hit new 52-week lows yesterday were global or international funds, a factoid emblematic of the struggles equity markets outside the U.S. have faced this year.
While emerging markets ETFs have continued to be thorns in the sides of investors, well-known developed markets funds have provided little relief. Over the past six months, the iShares MSCI EAFE ETF (NYSEArca: EFA) and the Vanguard FTSE Developed Markets ETF (NYSEArca: VEA) are down an average of 9.5% while the S&P 500 is higher by 5.6%. [Asset Allocation With ETFs]
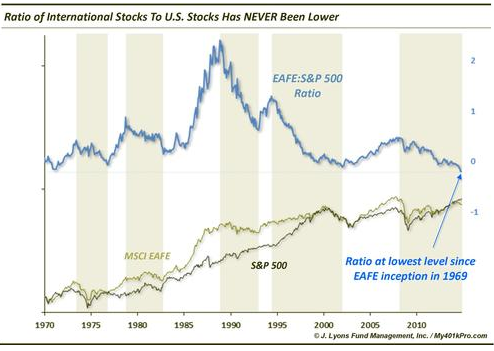
This is how bad things have gotten for ex-U.S. developed market equities against the S&P 500: A ratio measuring the MSCI EAFE Index, EFA’s underlying index, against the benchmark U.S. index hovers near its worst levels in four and a half decades.
“Specifically, the ratio between the performance of the EAFE (which stands for Europe, Australasia and the Far East) and the S&P 500 hit an all-time low in November. A 45-year low should paint the picture pretty clearly regarding the magnitude of under-performance on the part of foreign stocks,” according to Dana Lyons of J. Lyons Fund Management.
Arguably, things should not be this way for EFA. The ETF allocates 21% of its weight to Japan, which has treated investors to a (until recently) stimulus-induced tumble in the yen. The European Central Bank has quantitative easing designs of its own, which is important to EFA because the ETF allocates over 27% of its weight to five Eurozone economies. [Getting Bearish With Euro ETFs]
However, neither EFA nor VEA are currency hedged ETFs, indicating that both expose investors to significant currency risk should the U.S. dollar remain a darling among major currencies. This is a vital consideration when acknowledging dollar weakness from 2000 through 2013 account for nearly all of the MSCI EAFE Index’s upside. [Currency Hedged ETFs Shine]
A silver lining could be emerging.
“The other takeaway that we should keep in mind is that the relative performance is cyclical. Periods of long under-performance have been followed by long periods of out-performance. The 4 intermittent cyclical periods of EAFE relative strength have lasted an average of nearly 4 years and produced a median out-performance by the EAFE of 7800 basis points,” notes Lyons.
Investors looking to wade back into EAFE stocks in anticipation that developed markets will rebound against the U.S. next year can consider an ETF such as the Shares MSCI EAFE Minimum Volatility ETF (NYSEArca: EFAV).
The low volatility approach to EAFE stocks has been significantly less bad over the past six months. EFAV is down just 4.4% over that time, a loss that is half as bad as EFA’s. The $1.2 billion EFAV features a larger weight to Japan than does EFA and much of the former’s low volatility advantage is attributable to its sector weights. [Lowering Volatility With International ETFs]
EFAV’s combined weight to consumer staples and health care stocks is almost 31.5%, or about 940 basis points higher than EFA’s weight to those sectors.
MSCI EAFE Index vs. S&P 500
Chart Courtesy: J. Lyons Fund Management
Tom Lydon’s clients owns shares of EFA.