The S&P 500 is up 5.6% over the past month and has been , on what feels like an almost daily basis, hitting record highs.
At the sector level, however, there are ample signs investors are eschewing risk, a scenario confirmed by the recent, overt favoritism investors have afforded consumer staples exchange traded funds. For example, the Consumer Staples Select Sector SPDR (NYSEArca: XLP) has outpaced the S&P 500 by 60 basis points over the past month.
Since the start of the fourth quarter no sector ETF has added more new assets than XLP and only eight ETFs of any type of have added more new assets than the $1.44 billion that has flowed into XLP, the largest staples ETF. [Investors Rush to Safe Staples ETFs]
The impressive performances notched by XLP and rival staples ETFs are not problematic, but what is potentially worrisome is the inability of consumer discretionary ETFs, such as theConsumer Discretionary Select Sector SPDR (NYSEArca: XLY), to usurp their staples counterparts. As has been previously noted, the XLY/XLP ratio can prove effective in measuring investors’ appetite and warning of market pullbacks. [Worrisome News for Discretionary ETFs]
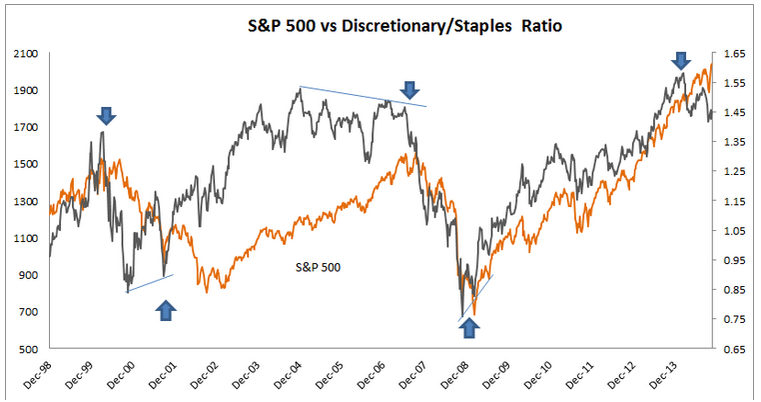
“One quick way to analyze investors’ appetite for risk is to look at the ratio of Consumer Discretionary (XLY) vs Consumer Staples (XLP) stocks. The idea here is when investors are willing to take on more risk, they favor XLY and thus, the ratio line will move upward,” notes Tom Psarofagis of AGD Capital Management.
To be fair, XLY has not been an awful trade. The largest discretionary ETF hit a new all-time higher earlier Thursday and has returned almost 2.2% over the past 90 days. However, that 2.2% gain lags the S&P 500 by 80 basis points while XLP has been three and a half times better over the same period. Additionally, XLY is in the midst of its seasonally favorable period.
Still, the XLY/XLP ratio and its penchant for forecasting previous market declines should be monitored closely by investors.
Chart Courtesy: AGD Capital Management
“As you can see, the ratio did a pretty good job of foreshadowing major market moves. As the market continues to rally off its 2009 bottom, the ratio had also been making higher-highs, pretty much in tandem. It’s recently where we are starting to see a divergence where the market grinds higher and the ratio fails to make higher highs. The same divergence was occurring before the market collapsed in 2008,” said Psarofagis. “Although in isolation, this indicator doesn’t necessarily constitute a “sell signal”, but has been a fairly good early warning of risk aversion and analyzing the sustainability of the market’s advance.”