After bursting out of the gates to start 2014, some agriculture exchange traded products have spent the better part of the past seven months in tailspins.
The PowerShares DB Agriculture Fund (NYSEArca: DBA), which surged in the early part of this year, is now up just 5.9% compared to a 10.2% gain for the S&P 500. However, the pain for agriculture ETFs and exchange traded notes (ETNs) appears to be abating with potentially significant rallies ahead for previously maligned ETFs and ETNs featuring exposure to corn, grains, soybeans and wheat. [Corn ETF Rallies After USDA Trims Forecast]
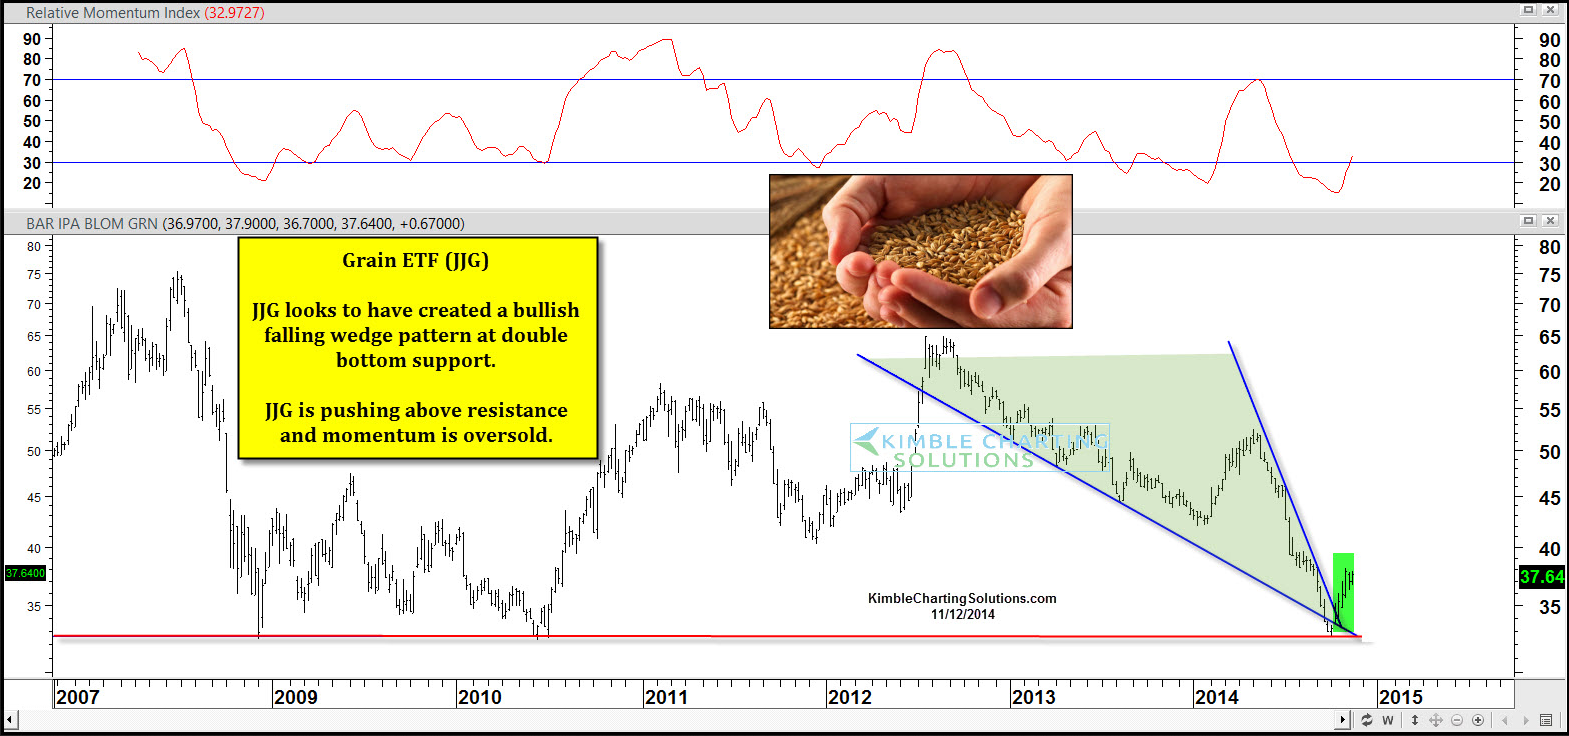
Over the past month, the iPath Dow Jones-UBS Grains Subindex Total Return ETN (NYSEArca: JJG) has surged nearly 9% and the ETN’s charts say that rally may just be getting started.
“The Power of the Patterns take on JJG is this – A bullish falling wedge seems to have formed, which suggests that 65% of the time a rally will take place. This bottom of the wedge formed at a potential triple bottom,” notes Chris Kimble of Kimble Charting Solutions. “JJG of late appears to be breaking out to the upside of this bullish falling wedge. To no surprise, sentiment levels are very depressed in all three grains, with Soybeans having the fewest bulls of the three, just 28%.”
Chart Courtesy: Kimble Charting Solutions
JJG, home to $173.5 million in assets under management, is also home to several of the most disdained agriculture commodities, potentially giving the ETN potency as a trade that pays off for the bulls due to extreme bearish sentiment.
Of the 17 worst-performing commodities this year, three are corn, soybeans and wheat, which just happen to be three commodities found in JJG.
On an individual basis, each of those three commodities have been perking up in recent weeks. This how strong that trio has been: Of the Teucrium Corn Fund (NYSEArca: CORN), Teucrium Soybean Fund (NYSEArca: SOYB) and theTeucrium Wheat Fund (NYSEArca: WEAT), WEAT is the worst performer over the past month with a gain of 4.6%. SOYB and CORN are up an average of 8.3% over that period. [Obscure Ratio Could be Good News for Corn]
Last month, Teucrieum highlighted favorable signals from the gold/corn ratio, indicating that more upside could be on the way for corn. Similar scenarios could be afoot for SOYB and WEAT.
“The Gold/Soybean Ratio is defined as the number of bushels of soybeans one could buy with the proceeds from selling one troy ounce of gold at a specific day’s settlement prices,” according to Teucrium.
As of the end of the third quarter, the gold/soybean ratio resided just below 133, nearly double the mean seen since 1976. At the end of the third quarter, the gold/wheat ratio was 253.4, more than double the mean of 122.5 since 1976, according to Teucrium data.
“The gold/corn ratio may have been at its historic 38 year high at the end 2014’s third quarter, but other major agricultural crops were also very near all-time historic highs for the same time period,” according to Teucrium.
Gold/Soybean Ratio
Chart Courtesy: Teucrium