Gold is a component in an array of investment ratios, most notably the gold/silver ratio, or the measure of how many ounces of silver it takes to buy one ounce of gold.
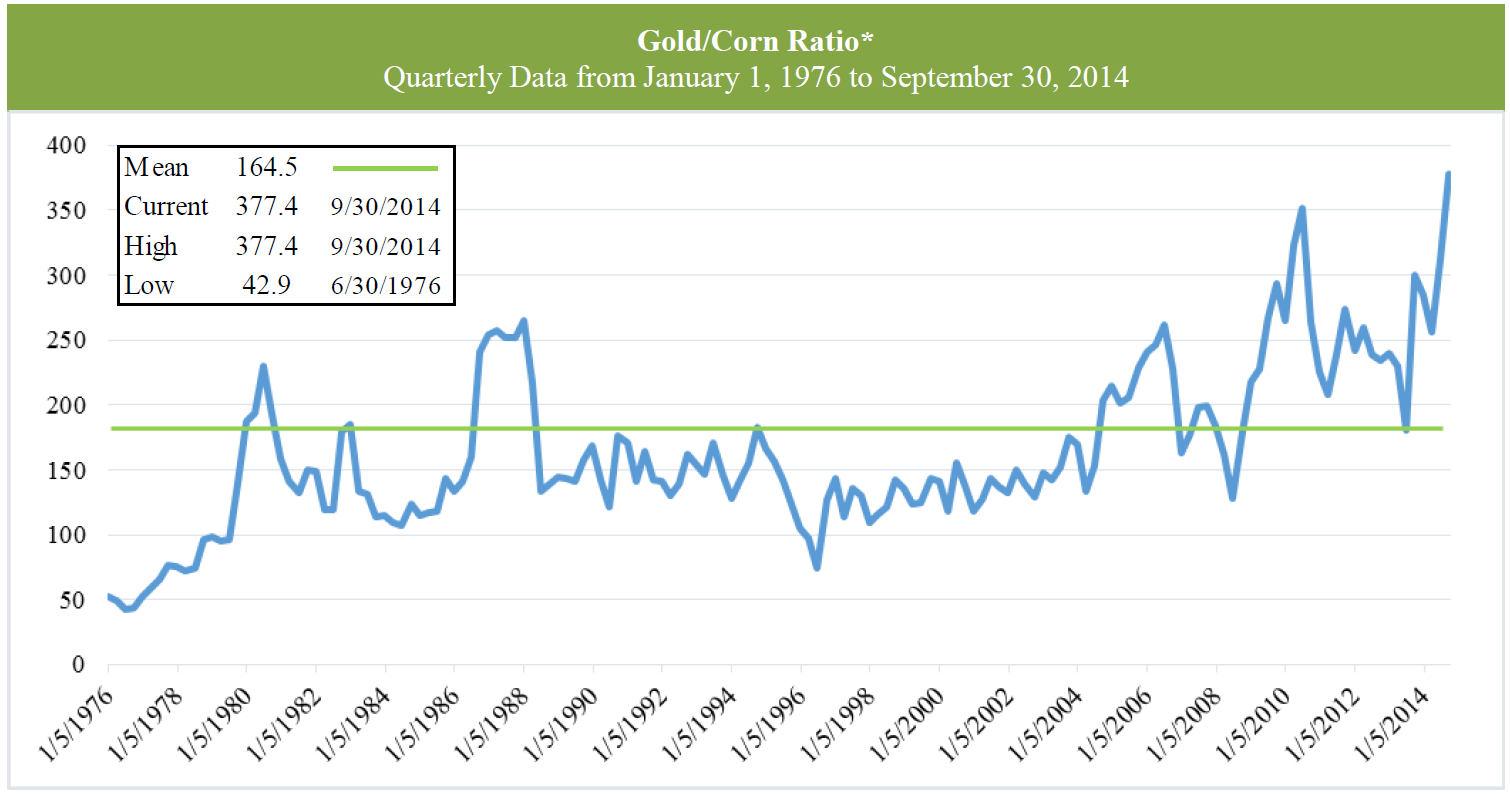
The gold/corn ratio is undoubtedly one of the less heralded gold ratios, but commodities investors ought to listen to what this ratio is currently saying. The Gold/Corn Ratio is defined as the number of bushels of corn one could buy with the proceeds from selling one troy ounce of gold at a specific day’s settlement prices, according to Teucrium, the issuer of the Teucrium Corn Fund (NYSEArca: CORN).
The SPDR Gold Shares (NYSEArca: GLD), iShares Gold Trust (NYSEArca: IAU) and the ETFS Physical Swiss Gold Shares (NYSEArca: SGOL) have each tumbled about 6% over the past 90 days, but even with those declines, gold appears overvalued relative agriculture commodities.
“Examining quarterly data from the beginning of 1976 (the year that gold started trading freely in the United States) through the quarter ended September 30, 2014, suggests that gold is over-valued relative to historical price relationships with the major agricultural crops of corn, wheat, soybeans and sugar,” according to a recent research note published by Teucrium.
The timing of examination of the gold/corn ratio is important as it appears the ratio is proving efficacious. Over the past month, GLD and friends are up about 1%, but with Monday’s gain, CORN is up nearly 12% over the same period. [Be Picky With Commodity ETFs]
“The gold/corn ratio may have been at its historic 38 year high at the end 2014’s third quarter, but other major agricultural crops were also very near all-time historic highs for the same time period,” notes Teucrium.
Some of those other ratios are working as well. For example, the Teucrium Wheat Fund (NYSEArca: WEAT) has added more than 7% over the past month while the Teucrium Soybean Fund (NYSEArca: SOYB) has surged 8.2% when including Monday’s gain. [These Commodities ETFs Buck Outflows Trend]
“Notably, Wheat prices have basically taken a pounding in 2014, with WEAT down >20% year to date, in spite of a huge bounce in the short term throughout the month of October until this point. Briefly trading above $12 Friday morning, WEAT has regressed rather sharply off of these recent highs and seems to be seeing some static around its 50 day MA ($11.73),” according to a note published by Street One Financial Monday.
Since the start of the fourth quarter, CORN has added $9.6 million in new assets while SOYB has seen modest inflows, but GLD has bled $959.1 million over the same period.
“At 377 bu/oz the gold/corn ratio is approximately 128% above its nearly four decade average of 165 bu/oz. Hypothetically, if an investor sold gold and purchased corn at the current 377 bu/oz level, and the ratio subsequently retraced by 50% to a level of approximately 189 bu/oz, the investor would then be able to sell the corn and buy back twice as much gold, essentially doubling their initial investment. Moreover, the assumption of a significant 50% reversion to 189 bu/oz levels would still leave the gold/corn ratio almost 14% above the historic mean of 165 bu/oz,” according to Teucrium.
Gold/Corn Ratio
Chart Courtesy: Teucrium
Tom Lydon’s clients own shares of GLD.