With Wednesday’s 3.1% tumble, FCG is now down 35.4% from its June peak. That decline represents nearly two full bear markets with a 20% fall being necessary to define one new bear market.
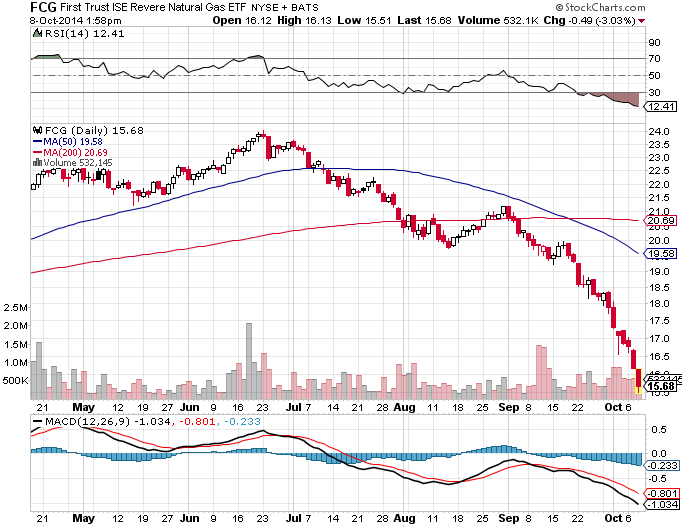
On a technical basis, FCG’s chart is a nightmare. The ETF trades an average of 22% below its 50- and 200-day moving averages while its RSI reading is deeply oversold at just over 12. That oversold reading may not be a buy signal. FCG’s RSI on its daily chart entered oversold territory last month when the ETF was still flirting with $20. Today, the ETF resides below $16.
First Trust ISE-Revere Natural Gas Index Fund