The third quarter brought a severe repudiation of energy stocks, turning what was earlier this year the best-performing sector in the S&P 500 into a laggard.
Energy, which accounts for over 9% of the benchmark U.S. index, tumbled 9.2% during the third quarter as oil prices tumbled the U.S. dollar rose. During the July through September time frame, the Energy Select Sector SPDR (NYSEArca: XLE), the largest equity-based energy ETF, lost 9.5% as the United States Oil Fund (NYSEArca: USO) tumbled 11.5%. [Sector ETFs Hoping for Dollar Reversion]
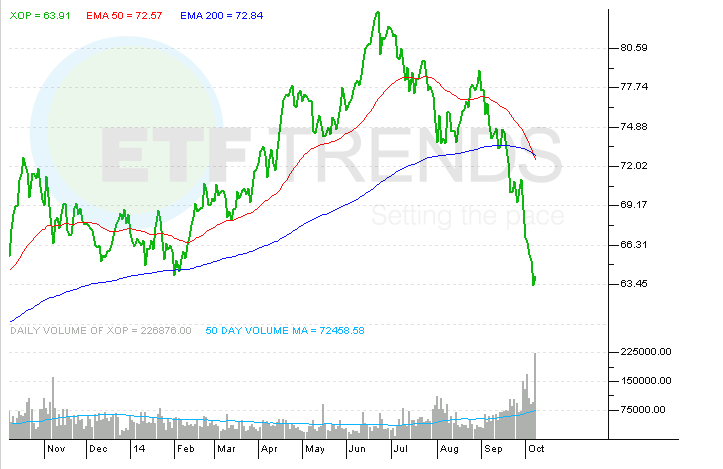
An even more egregious energy offender during the third quarter was the SPDR S&P Oil & Gas Exploration & Production ETF (NYSEArca: XOP), an ETF popular with active traders and short sellers alike due to the ETF’s penchant for volatility. The $1.1 billion XOP plunged 16.5% last quarter, but the equal-weight ETF’s chart indicates a rebound could be in the offing.
After XOP violate the $73 area, “which it had held successfully no fewer than a dozen times since breaking above it in April. From that day forward, it has dropped…and dropped…and is still dropping. In the September 15 post, we stated that “…a break of $73 would target an area around $63”. XOP achieved that target yesterday, capping a stunning 13% drop in just 13 days,” according to J. Lyons Fund Management.
Dana Lyons of J. Lyons believes XOP has achieved a downside target of $63 caused by a bearish head and shoulder chart formation. Securities, including ETFs, have a tendency to rally and recover some of the loss induced by the head and shoulders after the pattern has run its course, which it appears to have done with XOP.
To be sure, XOP still faces hurdles as traits of the ETF that were once advantages are currently disadvantages. Namely, XOP has been an attractive option for investors looking to avoid the arguably excessive exposure to Dow components Exxon Mobil (NYSE: XOM) and Chevron (NYSE: CVX), the two largest U.S. oil companies. [An Energy ETF in Rally Mode]
Although the ETF’s 91 holdings have a weighted average market value of nearly $17.5 billion, XOP’s exposure to smaller energy names is hindering the ETF at a time when the iShares Russell 2000 ETF (NYSEArca: IWM) is coming off a third-quarter loss of nearly 9%.
XOP does have the benefit of favorable valuations after the aforementioned tumble. XOP currently sports a P/E ratio of just 15 with a price to book ratio of about 1.6 while the S&P 500 is hovering around a 17.1 P/E and a 2.4 P/B. [Compelling Valuations With Energy ETFs]
SPDR S&P Oil & Gas Exploration & Production ETF