“WTIND’s P/E ratio is approximately 14.0x—reflecting the 2014 Index screening—i.e., almost 25% lower than the 18.4x P/E ratio of the S&P CNX Nifty Index (Nifty Index) or the 18.6x P/E ratio of the MSCI India Index,” said Gannatti.
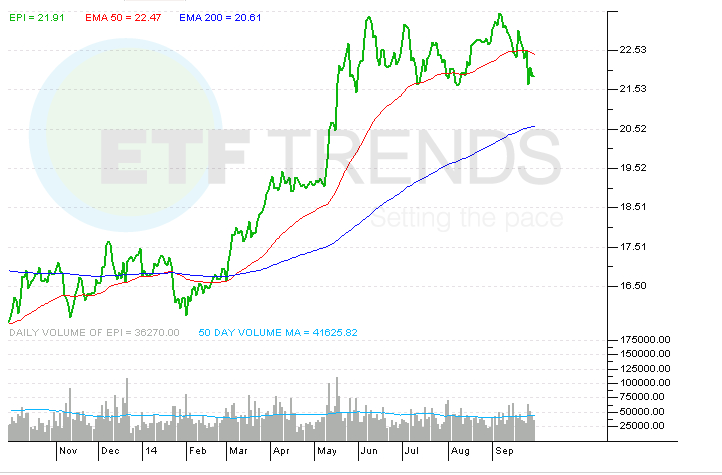
The nearly $2 billion EPI currently allocates 24.2% to the financial services sector, about 550 basis points more than ETF’s energy allocation, its second-largest sector weight.
EPI’s financial services exposure could prove beneficial after S&P recently raised the country’s credit outlook, reducing the prospect of a downgrade to junk status any time soon, indicating higher borrowing costs are not an imminent threat for Indian firms. [India ETFs Look Worthy After S&P Outlook Boost]
India, like BRIC-mates Brazil and Russia, has a sovereign rating of BBB-, S&P’s lowest investment grade. Additionally, the improved outlook on Indian bond securities helps diminish the risk of a major sell-off once the U.S. hikes interest rates. Global investors pulled $8 billion out of rupee-denominated bonds last year after the Federal Reserve began tapering its bond purchasing program. [Emerging Asia ETFs Can Shake Off Effects of Rising U.S. Rates]
WisdomTree India Earnings Fund
Tom Lydon’s clients own shares of EEM.