After a sharp sell-off in March and languish trading through May, the biotechnology sector and related exchange traded funds are looking to break out.
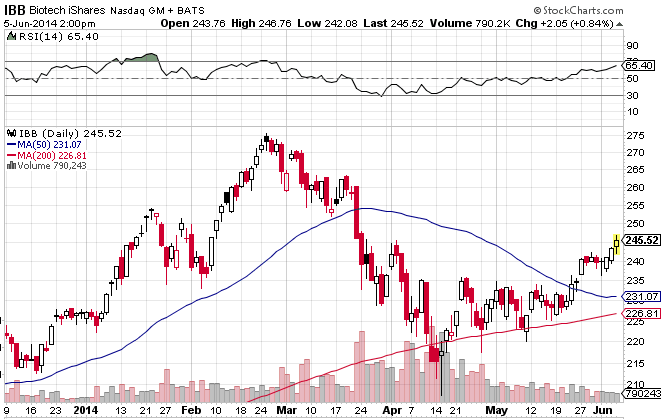
The iShares Nasdaq Biotechnology ETF (NasdaqGM: IBB), which tracks biotech and pharma stocks on the Nasdaq, fell 9.6% over the past three months, but the ETF is up 1.6% over the past week and 6.3% higher over the last month. Last week, IBB broke above its 50-day moving average. [Technical Update on the Big Biotech ETF]
Ed Ponsi, managing direction of Barchetta Capital Mangement, pointed out that IBB’s break above its short-term resistance level, the first time since March, was a bullish indicator, reports Lee Brodie for CNBC.
Furthermore, Ponsi noted that IBB broke out of a symmetrical triangle pattern that has formed for weeks. The symmetrical triangle pattern is recognized by its distinct triangle shape formed by two converging trendlines that connect recent peaks and troughs.
IBB’s symmetrical triangle pattern showed its trendlines converged around $231 per share – IBB currently trades around $245 per share. The two trendlines act as barriers on prices increases and decreases, but when the price breaches one of these lines, a sharp move typically follows. Currently, the ETF is breaking out on the bullish side.
Looking at individual picks, Ponsi argued that biotech firms like Celgene (NasdaqGS: CELG) and big pharma Regeneron (NasdaqGS: REGN) are also showing bullish chart patterns.
“That would mean the monster sell-off has created some terrific buying opportunities,” Mad Money’s Cramer noted in the article. “I think Ponsi is dead right.”
IBB includes a 8.4% weight toward CELG and a 4.1% allocation in REGN.
iShares Nasdaq Biotechnology ETF
For more information on the biotech sector, visit our biotechnology category.