Commentary (ain’t no bodies opinion but my own):
Companies reached into their deep pockets this quarter and spent an extra $30 billion more than the prior quarter on buybacks, buying more than they issued and reducing their share count
Takeaway: companies bought a tail wind for EPS, in a quarter when they needed it most
But the question is – was the increase in buybacks just to help a weather poor Q1 or the start of a new trend
Regardless Q2,’14 already has a tail wind: Q1,’14 shares / Q2,’13 shares, even before any Q2,’14 action
Companies continue to increase their shareholders’ returns through buybacks and cash dividends, with the two expenditures combined setting a new index record at $241.2 billion in the first quarter – surpassing the prior record of $233.2 billion set in Q3,’07
While dividend payments are historical high, the payout rate remains low, with dividends being 37% of As Reported earnings for Q1,’14 (33.8% over the last 5-years and 33.6% for estimated Q2,’14), compared to a historical average of 52% (from 1936)
Buybacks need to be measured against issuance, and the current trend (and hype) is share count reduction, resulting in enhanced EPS
I expect this trend of greater shareholder return to continue throughout 2014, as activists remain strong, interest rates low, and companies awash in cash
—————————————————–
Q1 2014 S&P 500 Buybacks (just the facts)
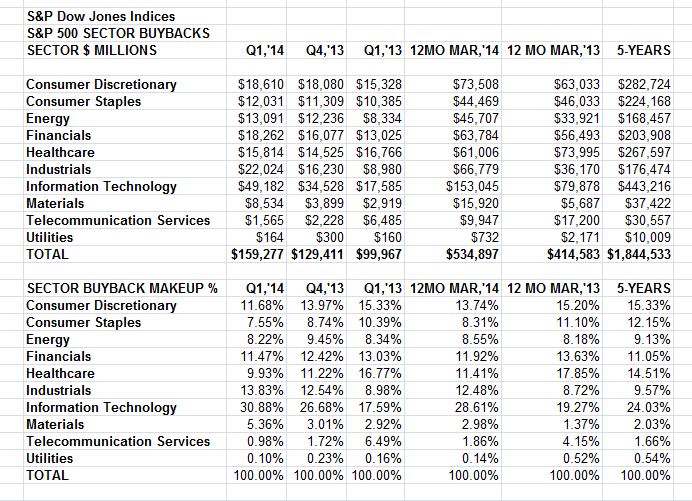
Q1,’14 buybacks increased 59.2% to $159.3B from Q1,’13 $100.1B, as the quarter became the second highest period
Highest was Q3,’07 at $172.0B, with #3 now being Q2,’07 with $157.7B
The expenditure gain over Q4,13’s $129.4B was 23.1%, when the average daily stock price was up only 3.7% (so the higher expenditure was not due to chasing higher prices)
Translation -> the additional $30B was used for Share Count Reduction (SCR), reducing the average diluted shares used for EPS calculation and increasing the EPS
12 month buybacks increases 29.0% to $545.9B from $414.6B (12 month high was Dec,’07 at $589.1B, recession low was 12 month Dec,’09 at $137.6 billion
Share counts go down, as companies buy more shares than they issue (it’s not just what you buy, but what you issue)
S&P announced the quarterly rebalancing last Friday, 6/13 (effective after the close this Friday, 6/20), with the S&P 500 market value reduced 0.5% due to the adjustment
For Q1,’14, 290 issues reduced their diluted share count, up from 276 in Q4,’13 and the 212 in Q1,’13, while 181 increased them, down from 185 in Q4,’13 and the 246 in Q1,’13
Significant changes of at least 1% in the quarter increased, with 123 issues reducing their count (112 in Q4,’13) and 30 increasing them at least 1% (24 in Q4,’13)
Significant changes of at least 4% for the year-over-year period, where EPS are used in comparison, increased to 99 issues from the 83 reported in Q4,’13, with 34 issues increasing their share count at least 4% (potentially diluting EPS, depending if the issuance was used for M&A which was anti-dilutive), up from 22 in Q4,’13.
Of the 404 issues that reported buybacks in Q1,’14 (up from 401 in Q4,’13), 346 of them pay a dividend (up from 339 in Q4,’13), with 217 of them (196 in Q4,’13) spending more on dividends than buybacks
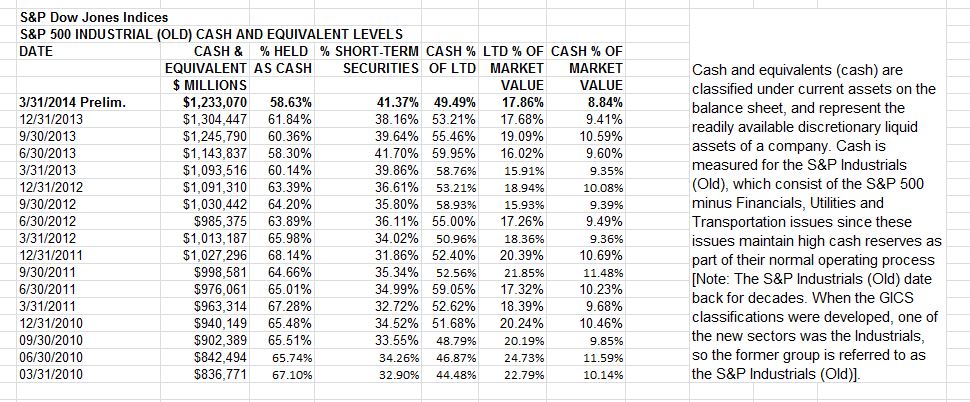
Cash (S&P 500 Industrials Old) declined after setting six quarters of consecutive record highs, as buybacks and M&A combined to reduce the holdings to $1.233 trillion from the Q4,’13 1.304 trillion record; the current level is equivalent to 90 weeks of net income siting on the books (here and abroad), earning very little, but getting a lot of attention from activists.
Information Technology maintained its dominance of buybacks, accounting for 30.88% of all buybacks in Q1,’14, up from 26.9% in Q4,’13
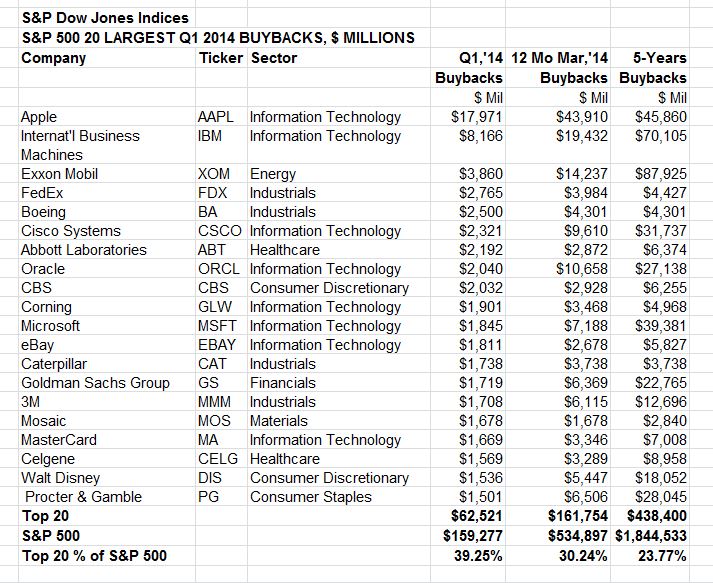
Apple set a record buyback expenditure of $18 billion in the first quarter, beating out the prior $16 billion record, which it held from Q2 2013. As a result of the large buybacks, Apple reduced its average diluted shares by 7.0% year-over-year, as it posted a 7.1% increase in net earnings, which due to a lower share count resulted in a 15.2% gain in EPS.


