A company’s payout ratio, or its percentage of profits paid out in dividends to shareholders, is a frequently used metric by investors to determine a firm’s ability to continue paying and growing dividends.
The higher the payout ratio, the more vulnerable the dividend is perceived to be, according to conventional wisdom. Courtesy of Brendan Conway for Barron’s, Credit Suisse looks at the fixed charge coverage ratio, a deeper dive on the payout ratio, that investors can use to determine the sustainability of payouts from various dividend exchange traded funds.
Credit Suisse “compared a range of obligations faced by dividend-paying companies — for instance paying the dividend itself, meeting recurring expenses such as interest, R&D, rent and capital expenditures and so forth — versus cash flows,” according to Barron’s.
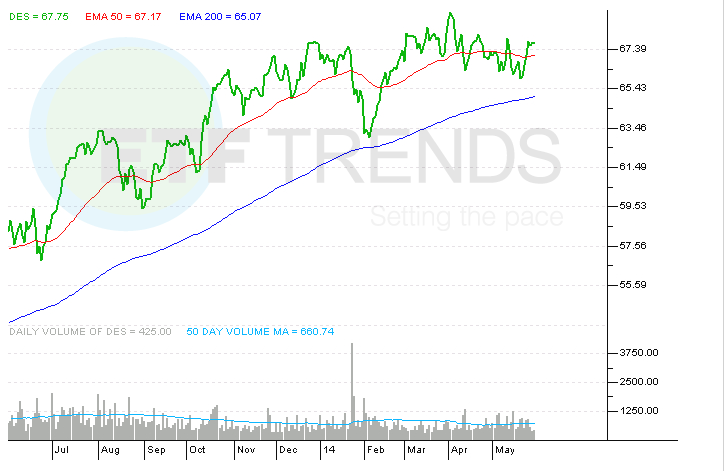
The Credit Suisse analysis shows the WisdomTree SmallCap Dividend Fund (NYSEArca: DES) has the best fixed coverage ratio as its more than 670 components have cash flow amounting to 1.5 times obligations, Barron’s reported.
DES is home to $1 billion in assets under management and a distribution yield of 2.1%. Companies in DES are pulled from the WisdomTree Dividend Index after the 300 largest market value firms are removed. The WisdomTree Dividend Index is the underlying index for the WisdomTree Total Dividend Fund (NYSEArca: DTD).
The WisdomTree SmallCap Dividend Index has a dividend yield of almost 3.3%. At a time when small-cap valuations are considered frothy, noteworthy is the 24.7 P/E ratio on DES, which while still above the S&P 500, is well below the P/E of almost 30 for the iShares Russell 2000 ETF (NYSEArca: IWM). [Small-Cap Dividends Prove Helpful]
Other well-known dividend ETFs that score well in terms of the Credit Suisse fixed charge coverage ratio include the Vanguard Dividend Appreciation ETF (NYSEArca: VIG), the largest U.S. dividend ETF, the First Trust NASDAQ Technology Dividend Index Fund (NasdaqGM: TDIV) and the WisdomTree LargeCap Dividend Fund (NYSEArca: DLN).
TDIV has soared in popularity as the technology has progressively become a more legitimate and attractive dividend destination over the past several years. The ETF has pulled in $220 million of its $530.1 million in assets just this year. [ A Tech ETF for Grandad]
The average payout increase from Apple (NasdaqGS: AAPL), IBM (NYSE: IBM), Cisco (NasdaqGS: CSCO) and Qualcomm (NasdaqGS: QCOM) this year is almost 14%. Those stocks combine for 29% of TDIV’s weight.
DLN and VIG are will not win any yield contests, but the tradeoff there is enhanced dividend safety as neither ETF is heavy on high-yielding, interest rate-sensitive sectors. For example, VIG allocates just 1.1% of its combined weight to utilities and telecom stocks, according to Vanguard data.
Conversely, the industrial and tech sectors, two of the top performers in rising rate environments, combine for over 34% of VIG’s weight. VIG’s trailing 12-month yield of about 1.9% is in line with the dividend yield of the S&P 500, but the fund has proven popular with investors due in large part to a methodology that mandates constituent firms have minimum dividend increase streaks of at least 10 years.
DLN, the WisdomTree offering, tracks the WisdomTree LargeCap Dividend Index (WTLDI), which yields 2.72%. That is about 20 basis points better than 10-year U.S. Treasuries. Tech and industrial names combine for 26.4% of DLN’s weight.
DLN pays a monthly dividend and has outpaced VIG by 500 basis points over the past three years. [Revisiting an Old Dividend ETF Friend]
Of the ETFs mentioned here that score favorably in the Credit Suisse analysis, only DES has a notable utilities sector allocation at 13.3%. However, several of the ETFs that rank poorly in the analysis have large weights to utilities, including some north of 25% and 30%.
WisdomTree SmallCap Dividend Fund
Tom Lydon’s clients own shares of Apple, Cisco and IWM.