After being glossed over in favor of higher beta, momentum offerings last year, exchange traded funds focusing on value stocks are enjoying their day(s) in the sun in 2014.
While the Global X Social Media Index ETF (NasdaqGM: SOCL) has entered a bear market with a three-month decline of 21.5% and the First Trust Dow Jones Internet Index Fund (NYSEArca: FDN) is lower by almost 12% over the same time, value ETFs have stood tall, delivering decent returns while proving prolific in gathering new assets. [Value ETFs: The New Black]
“Large-cap value securities were in vogue in our opinion as investors sought out the relatively safety of large caps that had discounted valuations, with the S&P 500 Index remaining near record highs,” said S&P Capital IQ in a new research note.
Investors are putting plenty of cash to work with value ETFs. As S&P Capital IQ notes, the iShares S&P 500 Value ETF (NYSEArca: IVE), iShares Russell 1000 Value ETF (NYSEArca: IWD) and the Vanguard Value ETF (NYSEArca: VTV) saw combined April inflows of $1.72 billion last month.
VTV, which S&P Capital IQ rates overweight, is one of the Vanguard ETFs that previously changed to indices developed by the University of Chicago’s Center for Research in Security Prices (CRSP) from MSCI indices. [Vanguard’s Big Index Swap]
“Unlike MSCI, CRSP uses a different approach, involving “packeting”, which allows a holding to be shared between two indices of the same family and cushions movement between indices. In other words, a stock can be in both the CRSP Large Cap Value and Large Cap Growth indices,” said S&P Capital IQ. “This plus what deems a stock to be a value or a growth stock to CRSP, MSCI, Russell or S&P Dow Jones Indices helps to explain the sector and performance differences between these similar sounding value ETFs. Whereas MSCI used book value/price ratio, 12-month forward earnings/price ratio and dividend yield, CRSP incorporates these factors along with sales/price and historical earnings/price ratio in forming its value universe.”
At the end of the first quarter, VTV featured a 22.3% weight to the financial services sector and a combined 37.3% weight to the health care, industrial and energy sectors. The ETF, which charges just 0.09% per year, features eight Dow components among its top-10 holdings with Berkshire Hathaway (NYSE: BRK-B) and Wells Fargo (NYSE: WFC) the outliers.
The $7.5 billion IVE is also rated overweight by S&P. IVE’s sector lineup is similar to VTV’s with a 23.1% weight to financials and a combined energy/health care/industrial weight north of 35%. IVE has a beta against the S&P 500 of 0.99 and a three-year standard deviation of 13.4%, according to iShares data.
IVE’s top-10 holding include Exxon Mobil (NYSE: XOM), J.P. Morgan Chase (NYSE: JPM) and AT&T (NYSE: T). The fund’s annual expense ratio is 0.18%.
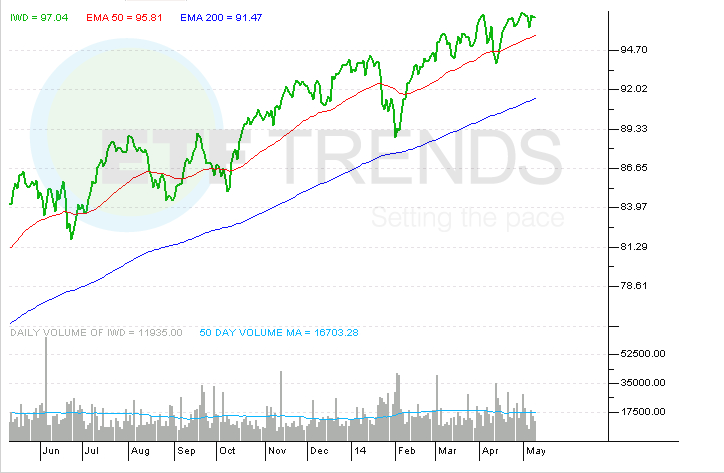
The $22.3 billion IWD also garners an overweight rating from S&P Capital IQ. IWD is more heavily tilted to financials with a 28.6% weight to that sector. IWD also features scant industrial exposure with a mere 0.36% weight to that sector. [Don’t Forget These Value ETFs]
Producer durables represent 10.2% of IWD’s weight with energy and health care combining for 28.1%. With 668 stocks, IWD holds more than twice as many names as VTV and nearly double the amount found in IVE.
“S&P Capital IQ discourages relying solely on backward looking analysis or an expense ratio in choosing ETFs, but rather encourages a focus on the securities inside and other costs of the ETF. All three of these ETFs have favorably strong risk considerations, using S&P Capital IQ Quality Rankings and Standard & Poor’s Credit Ratings of the holdings, and modest costs, using expense ratio and bid/ask spread analysis,” said S&P Capital IQ.
iShares Russell 1000 Value ETF