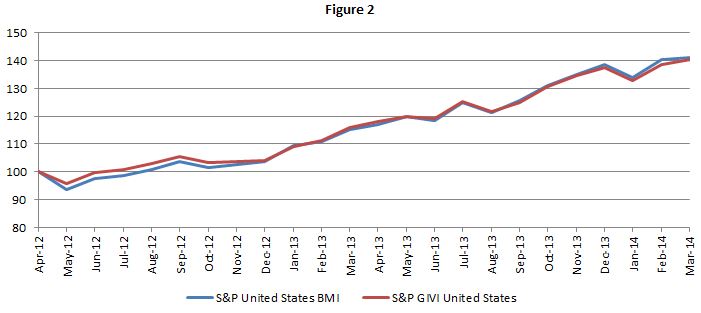
The recently published research paper on S&P GIVI®: Factor Investing: A Review of the S&P Global Intrinsic Value Index analyzes in detail the source of GIVI returns globally and regionally. S&P GIVI is a multi-factor global index which provides exposure to low volatility and the value factors by removing 30% of the highest beta stocks in each country and weighting the rest of the stocks by their intrinsic value. The case for factor investing has gathered momentum post the 2008 crisis when it became clear that diversification by sector, geography and size was not sufficient and factor diversification was equally essential. S&P GIVI launched in March 2012 and we now have almost two years of live performance data and back tested data for 13 years prior to 2012. Analyzing the live data we see immediately the benefit of low volatility in emerging markets which have seen severe volatility recently (Figure 1). In the US where markets have seen a sharp rise, the drag effect of a low volatility approach is negated by the value tilt which is experiencing a strong uptick (Figure 2).
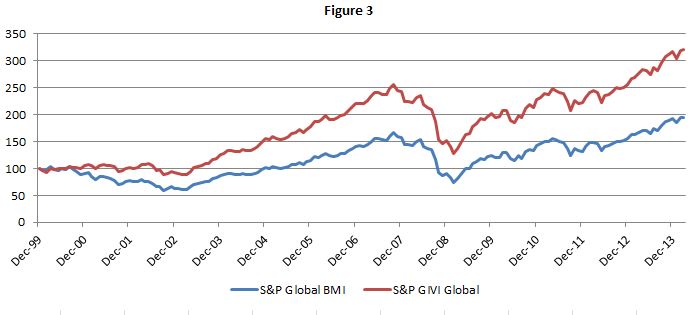
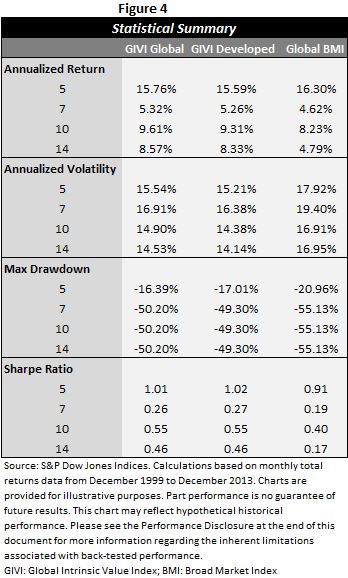
The full period (2000-2013) Sharpe ratio of the S&P GIVI Global is 0.46 which compares favorably with a Sharpe ratio of 0.17 for the corresponding market capitalization- weighted S&P Global BMI (Figure 3). While the performance gap shrinks when we examine shorter and more recent time periods, the S&P GIVI Global either matches or outperforms the S&P Global BMI during the corresponding time periods. The S&P GIVI Developed clearly outperforms the S&P Global BMI in every time period examined (Figure 4).