Now IAI’s technicals look discouraging.
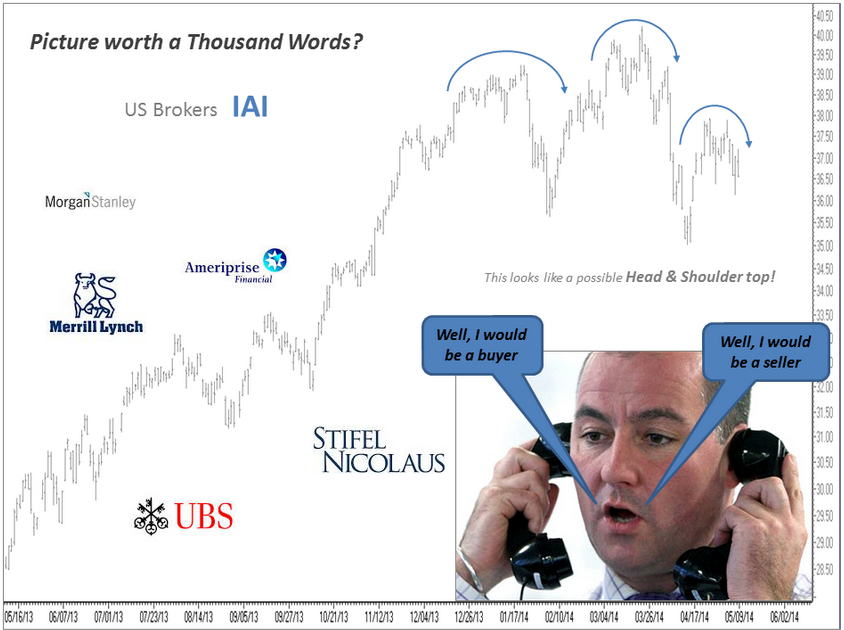
“These guys usually need to do well, just like its preferable to see banks to be acting well for a healthy market. So if the stockbrokers chart is not making nominal highs, is there a message? And it’s looking like it’s making a top, is that a leading indicator?,” notes Captain John Charts.
IAI’s chart shows sign of a bearish head and shoulders pattern. The ETF has not traded above its 50-day moving average since last month and is now just 2.3% above its 200-day line.
iShares US Broker-Dealers ETF
Chart Courtesy: Captain John Charts