The recent repudiation of some Internet and social media stocks has spurred speculation that the U.S. equity markets are on the cusp of a second technology bubble bursting this century.
Sector weights for some marquee broad market exchange traded funds, including the SPDR S&P 500 ETF (NYSEArca: SPY) and the PowerShares QQQ (NasdaqGM: QQQ) are telling a different story, particularly when it comes to technology sector exposure.
“At the height of the Internet bubble in March 2000, the Information Technology sector was 34.5% of the entire S&P 500. Eleven years prior, it had been just 5.9% of the index. And just two and a half years later at the October 2002 lows, tech was 12.8% of the S&P 500, says Nicholas Colas,chief market strategist at ConvergEx Group, a global brokerage company based in New York.
SPY entered Friday with an 18.53% weight to tech. QQQ’s tech weight today is close to what it was when the Internet/tech bubble burst, but the ETF’s weight to health care has more than doubled. More importantly, the NASDAQ-100, QQQ’s underlying index, had a P/E of almost 34 at the height of the tech bubble. QQQ had a P/E of 19.74 at the end of the first quarter. [QQQ Evolves for the Better]
Looking at some other sectors, financial services is still a long way from reclaiming its pre-financial crisis status as the largest S&P 500 sector.
“During the peak of the housing boom-inspired equity rally of the 2000s, Financials were 20.1% of the S&P 500. That was in October 2007. Not even two years later in March 2009, that weighting had collapsed to 8.9%. That’s the same level as all the way back in 1989,” said Colas.
Financials are 16.11% of SPY. The Guggenheim S&P Equal Weight ETF (NYSEArca: RSP) has a 16.33% weight to financials and a 12.77 tech weight. Consumer discretionary is RSP’s largest sector allocation at 16.36%. [Watch the Equal Weight S&P 500 ETF]
Looking at the average weights of sectors in the S&P 500 over time can be instructive.
“It is hard to know what an appropriate level for any sector might be, since growth rates and earnings power does shift from cycle to cycle. For reference, here is the average weighting for all 10 sectors from market peak (2007) to now: Energy (12.2%), Materials (3.5%), Industrials (10.8%), Consumer Discretionary (9.9%), Consumer Staples (11.2%), Health Care (12.4%), Financials (15.1%), Information Technology (18.1%), Telecomm (3.3%) and Utilities (3.7%),” notes Colas.
Interestingly, energy and utilities currently combine for less than 14% of SPY’s weight, but the Utilities Select Sector SPDR (NYSEArca: XLU) and the Energy Select Sector SPDR (NSYEArca: XLE) are up an average of 11.5% this year. Energy and utilities combine for almost 16% of RSP. [Sector ETF Ideas for May]
Tech and financials combine for 34.6% of SPY, but the Technology Select Sector SPDR (NYSEArca: XLK) and the Financial Select Sector SPDR (NYSEArca: XLF) are up an average of just 2.2% in 2014.
SPY Sector Weights
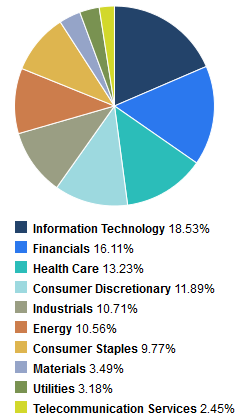
Chart Courtesy: State Street
Tom Lydon’s clients own shares of QQQ, RSP and SPY.