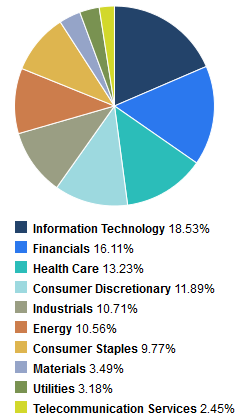
“It is hard to know what an appropriate level for any sector might be, since growth rates and earnings power does shift from cycle to cycle. For reference, here is the average weighting for all 10 sectors from market peak (2007) to now: Energy (12.2%), Materials (3.5%), Industrials (10.8%), Consumer Discretionary (9.9%), Consumer Staples (11.2%), Health Care (12.4%), Financials (15.1%), Information Technology (18.1%), Telecomm (3.3%) and Utilities (3.7%),” notes Colas.
Interestingly, energy and utilities currently combine for less than 14% of SPY’s weight, but the Utilities Select Sector SPDR (NYSEArca: XLU) and the Energy Select Sector SPDR (NSYEArca: XLE) are up an average of 11.5% this year. Energy and utilities combine for almost 16% of RSP. [Sector ETF Ideas for May]
Tech and financials combine for 34.6% of SPY, but the Technology Select Sector SPDR (NYSEArca: XLK) and the Financial Select Sector SPDR (NYSEArca: XLF) are up an average of just 2.2% in 2014.
SPY Sector Weights
Chart Courtesy: State Street
Tom Lydon’s clients own shares of QQQ, RSP and SPY.