Chinese demand also is relative to the rest of the world. They still have the highest demand growth in the world for oil and even if it is slowing, they are still consuming an additional 344 kb/d in 2014 (projected by the IEA) after a 278 kb/d incremental increase in 2013. The 344 kb/d is less than half of the consumption of the top 10 consumers in the world that the IEA projects will consume 834 kb/d more in 2014. It is actually the slowdown in the US which should be highlighted, where the demand growth is slowing the most, dropping to just 0.5% growth adding just 96 kb/d only behind Japan and Korea in 2014 (according to the IEA). The world should also watch demand coming from India, Russia, Brazil and Saudi Arabia, which taken together are more powerful than China on the demand front with an IEA projection of an additional 364 kb/d in 2014.
This is all interesting but oil is not the only commodity where the possible Chinese super-cycle bust doesn’t really matter. There are mixed impacts on copper, and as I have pointed out before, copper is not the best indicator of economic health. Currently inventories are at relatively low levels despite weaker Chinese demand.
Despite this inventory drop, the S&P GSCI Copper has fallen 9.05% this year. Undoubtedly, some of this loss is due to slower Chinese demand; however, more factors are at play. Copper is used as collateral for high risk loans where cash might not be available and the credit default caused a big scare. The bigger question surrounding copper’s future is probably around whether producers can deliver the supply they plan this year and whether Indonesia relaxes its export bans on copper concentrates.
This is evidence of the impacts of low inventories we have been seeing recently. Commodities this time around, in the new cycle, might not be primarily driven by the super-cycle of Chinese demand growth and may be more impacted by the supply side.
For further evidence, let’s examine the agriculture and livestock. Take a look at the chart below of hog and pig supply. A slowdown in Chinese demand is just not powerful enough to kill the virus driving the rally, where the S&P GSCI Lean Hogs is up 42.4% YTD.
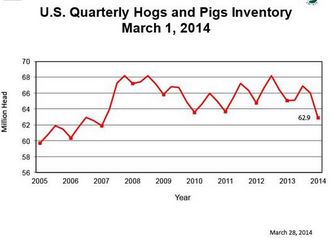
USDA National Agricultural Statistics Service. http://www.nass.usda.gov/Newsroom/2014/03_28_2014.asp
The S&P GSCI Agriculture has also spiked this year, up 15.1% YTD. This has been mainly due to weather that shocked the supply, again outpacing the demand drop from China due to the ban on GMO corn. It’s interesting that in the recent USDA report on World Agricultural Supply and Demand Estimates the focus is much more on China as a supplier than a consumer. Despite this, Agweb pointed out that China is still the third largest importer of US corn and the USDA projects imports to triple from 236 million bushels in 2014/5 to 836 million bushels by 2023. Some say a similar pattern in soybeans could follow. That seems like super demand growth even with the end of a super-cycle.
This article was written by Jodie Gunzberg, Global Head of Commodities, S&P Dow Jones Indices.
© S&P Dow Jones Indices LLC 2013. Indexology® is a trademark of S&P Dow Jones Indices LLC (SPDJI). S&P® is a trademark of Standard & Poor’s Financial Services LLC and Dow Jones® is a trademark of Dow Jones Trademark Holdings LLC, and those marks have been licensed to SPDJI. This material is reproduced with the prior written consent of SPDJI. For more information on SPDJI, visit http://www.spdji.com.