Rarely, if ever, do we see a fund sponsor have more assets in their small cap ETF strategy than their large cap ETF, butsuch is the current situation at RevenueShares ETFs. RWJ (RevenueShares Small Cap Fund, Expense Ratio 0.54%) has gathered about $260 million since its February 2008 inception while RWL (RevenueShares Large Cap Fund, Expense Ratio 0.49%) has approximately $221 million in assets under management.
This fund has turned in extremely impressive performance since inception when compared to its market cap weighted Small Cap benchmarks, which one can safely call the S&P SmallCap 600 and the Russell 2000 Indexes.
Critics of revenue weighted index strategies, and fundamental or quantitative indexing in general will likely have a hard time dismissing RWJ’s 4000 basis point excess return over the S&P SmallCap 600 and its 5300 basis point excess return over the Russell 2000 Index, (relevant ETFs are IJR (iShares Core S&P Small Cap, Expense Ratio 0.16% and IWM (iShares Russell 2000, Expense Ratio 0.28%)) that is evident since the fund’s 2008 inception.
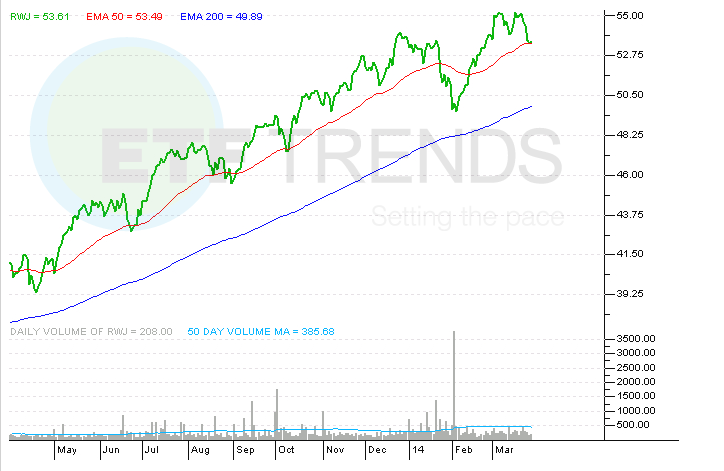
“Revenue Weighting” is a concept that we have covered in the past, but it is worth revisiting given RWJ’s recent challenge of its all-time high. The index “universe” for the fund is identical to that of the cap weighted S&P SmallCap 600 Index.
However, the formula used to calculate the individual equity weightings within the ETF is what differs the most here and what investors that are using Small Cap ETFs as part of their overall portfolio strategy are likely sleeping on.
Unlike a reportable metric like “revenue” or “sales”, the market capitalization of a company is not something that is tied to company fundamentals, but rather a function of supply and demand basically for that underlying stock. The market-cap weighted IJR and IWM (and several other market cap index based ETFs) clearly are immensely popular products judging by their levels of assets under management of $14.2 billion and $28.8 billion respectively, so one would think some assets are up for grabs in terms of where ETF investors tend to allocate.
The “revenue weighted” version of the S&P Small Cap 600 however looks much different from the S&P Small Cap Index itself, which is of course market cap weighted. Top five holdings of RWJ are currently CNC, SNX, SAH, GPI, and LYV, but no individual holding makes up more than 1.86% of the fund.
Top weightings in IJR are FEIC, KATE, TTC, TDY, and POL, with the largest holding (FEIC) making up only 0.62% of the fund. These company weightings differences, as well as potential “sector” tilts that may exist in the revenue weighted index as compared to the cap weighted counterpart may at times look like subtle differences and perhaps at added cost in terms of expense ratio to the investor, but it’s hard to argue with the success that this strategy has had in a live ETF environment in a 6+ year time period.
The ultimate decision weighs mostly on the willingness of the investor or portfolio manager to potentially have investment results that vary significantly from the index benchmarks, which is not a stretch given the success and size of actively managed U.S. Small Cap equity Mutual fund marketplace.
RevenueShares Small Cap Fund
For more information on Street One ETF research and ETF trade execution/liquidity services, contact Paul Weisbruch at pweisbruch@streetonefinancial.com.
Street One Financial is an educational/research firm utilizing the Broker Dealer services of GWM Group Inc (RLCC) a FINRA registered Broker/Dealer. All trades are executed through GWM Group (RLCC) and cleared by Fidelity (NFS)DTC number 0226. Street One Financial LLC makes available products and services offered by GWM Group Inc., a registered broker-dealer and Member Securities Investor Protection Corporation (SIPC), Investing in securities involves risks, and there is always the potential of losing money when you invest in securities.