Retail stocks and exchange traded funds struggled in December and January. Blame it on the weather, investors’ skittishness regarding holiday sales reports, soft economic data or all three factors.
Either way, the SPDR S&P Retail ETF (NYSEArca: XRT) tumbled from the start of December through the end of January after peaking in November. XRT’s woes, induced by some of the most controversial retailers, including Aeropostale (NYSE: ARO), Best Buy (NYSE: BBY), J.C. Penney (NYSE: JCP) and Sears (NasdaqGS: SHLD), forced serious technical damage on the $755.2 million ETF. [Mixed View on Discretionary ETFs]
The good news is that retailers are reversing for the better, a sign that it could be time for investors to once again warm to XRT and rival ETFs.
“The retail ETF made what chart watchers call a ‘V’ bottom in early February to reverse a sharp decline into an equally as sharp recovery, and it has been all rally ever since,” reports Michael Kahn for Barron’s. “The question now is whether this is sustainable, given the performances of both blue-chip retail companies and what I call the ‘walking dead.’ The answer is a qualified yes: The caveat is that the retail sector needs the market as a whole to stay strong.”
The walking dead of the retailer sector could easily include the aforementioned stocks, which were mentioned by Barron’s. However, there are times when a sector’s most controversial names present investors with the most opportunity. That appears to be happening right now with retailers. For example, shares of Sears are up 30% in the past month. Best Buy is up 10.6% while J.C. Penney is 59%.
XRT is an equal weight ETF and none of its 103 holdings account for more than 1.48% of the fund’s weight. That should limit the damage inflicted upon the ETF by a small number of stocks, but Sears, J.C. Penney and Best Buy combine for less than 2.7% of the ETF’s weight. [Black Friday ETFs]
A rebound in retail stocks and ETFs at this time of year is not a coincidence. Historically, the retail sector has outperformed the S&P 500 from Jan. 21 through April 12, according to Thackray’s 2014 Investors Guide. Important to note about seasonal trends is that they start (and end) four weeks after the initial start date, indicating XRT’s February rally fits the trend’s parameters.
From 1990 through 2013, the retail sector posted an average gain of 8.8% during its seasonally strong period compared to an average gain of 2.4% for the S&P 500 over the same period while outperforming the benchmark U.S. index on all but five occasions, according to Thackray’s 2014 Investors Guide.
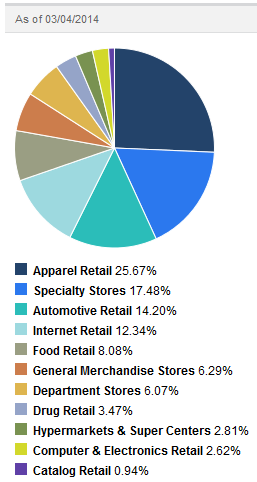
XRT Sector Allocations