VO tries to reflect the performance of the CRSP US Mid Cap Index. CRSP’s weighting methodology differs from the S&P. Consequently, the average market for a stock in the underlying index is $9 billion, which is less than the $62 billion in the S&P 500 and a little more than the $4 billion for the S&P 400. [Mid-Cap ETFs Keep Soaring]
IJH has been the lead of the pack with a two-year run of 50%. IJH has four double-digit sector allocations – financial services, industrials, technology and consumer discretionary . That group combines for over 69% of the ETF’s sector weight. IJH has a beta of 1.03 against the S&P 500 and a three-year standard deviation of 15.35%, according to iShares data.
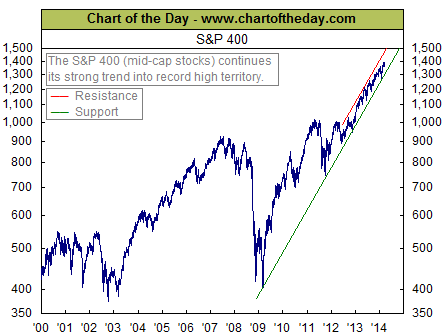
Chart Courtesy: Chart of the Day
ETF Trends editorial team contributed to this post. Tom Lydon’s clients own shares of VO.