Exhibit 2: Performance History of S&P 500, VIX and S&P 500 VIX Short-Term Futures Index
To avoid paying too much for downside protection, investors have to adjust their allocation to VIX futures wisely and implement “just-in-time hedging”. To help investors to dynamically allocate to VIX, S&P Dow Jones Indices launched the S&P 500 Dynamic VEQTOR Index (“VEQTOR”) as a prepackaged investment solution. The Index monitors two market signals, implied volatility trend and realized volatility, and allocates dynamically to equity and volatility. It also has a “stop-loss” feature that moves 100% to cash when the index has experienced more than 2% loss in the past five business days.
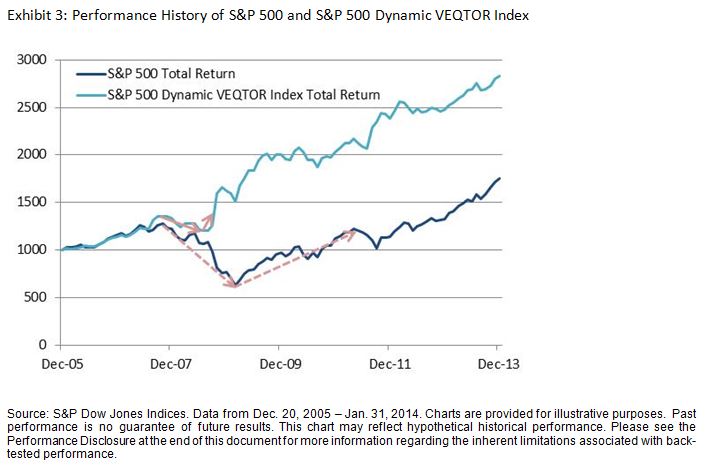
Compared to S&P 500, VEQTOR shows lower maximum drawdown and faster recovery. On 3/9/2009, the S&P 500 dropped 55% since its previous peak (2447.08 on 10/9/2007). It took 1120 calendar days to recover (2449.08 on 4/2/2012). VEQTOR saw its maximum drawdown on 9/15/2008 when it dropped 18% since its previous peak (137005.24. on 10/9/2007). It took only 31 calendar days to restore that level (140308.26 on 10/6/2008). See Exhibit 3.
As all volatility reduction products, VEQTOR outperforms in bear market. It also participates in the growth but underperforms in strong bull market.
This article was written by S&P Dow Jones Indices Director Berlinda Liu.
© S&P Dow Jones Indices LLC 2013. Indexology® is a trademark of S&P Dow Jones Indices LLC (SPDJI). S&P® is a trademark of Standard & Poor’s Financial Services LLC and Dow Jones® is a trademark of Dow Jones Trademark Holdings LLC, and those marks have been licensed to SPDJI. This material is reproduced with the prior written consent of SPDJI. For more information on SPDJI, visit http://www.spdji.com.