2013 is the first year commodities have been in backwardation since 2003. For those of you who need a refresher on the definition of backwardation, you are not alone, so here it is: ”When a near-month futures contract is trading at a premium to more distant contracts, we say that a commodity futures curve is in “backwardation” or that the commodity is “backwardated.” This occurs when inventories of commodities are tight so market participants are willing to pay a premium to buy the immediate deliverable commodity. Theoretically there is no value to carrying costs such as storage, insurance and interest costs since there is a scarcity of the commodities.”
Also, for illustrative purposes, this graph may help:
Chart is provided for illustrative purposes only.
The measurement of the historical backwardation (and contango, which is the converse of backwardation) shown in the chart below calculates the annual roll yield by taking the annual return of the S&P GSCI Excess Return (which measures the price return plus the roll return) less the annual returns of the S&P GSCI Spot Return (which measures the price return only). Backwardation was implied by a positive result, whereas contango was implied by a negative result. Notice 2013 had the first positive result since 2003.
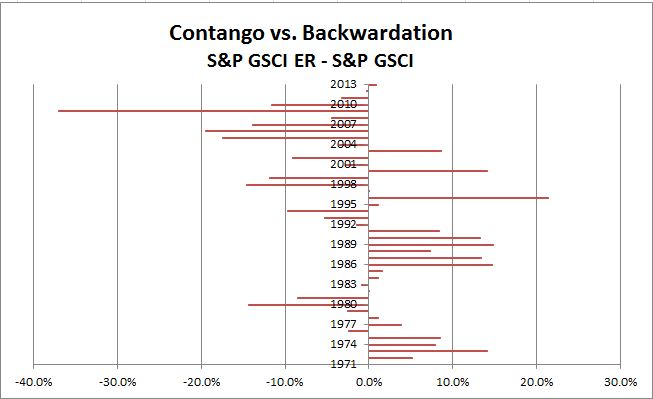
Source: S&P Dow Jones Indices. Data from Dec 1970 to Dec 2013. Past performance is not an indication of future results. This chart reflects hypothetical historical performance. Please see the Performance Disclosure at the end of this document for more information regarding the inherent limitations associated with backtested performance.