Equity-based energy exchange traded funds with hefty allocations to the biggest U.S. oil stocks, such as Exxon Mobil (NYSE: XOM) and Chevron (NYSE: CVX), have been decent though not spectacular performers this year.
For example, the Energy Select Sector SPDR Fund (NYSEArca: XLE) is up an S&P 500-lagging 23% year-to-date. Recently, XLE was shuttled down to the fifth spot from third in terms of assets among the nine sector SPDR ETFs. [XLV Rises to Third Spot Among Sector ETFs]
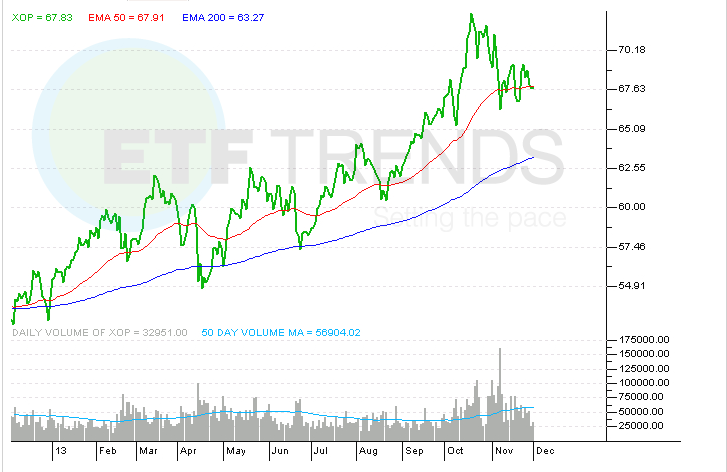
Investors willing to incur more volatility have done better with the SPDR S&P Oil & Gas Exploration & Production ETF (NYSEArca: XOP), which has gained 26% this year. More upside could be on the way for the $1.08 billion XOP.
XOP’s “50-day moving average has remained in an uptrend throughout the basing action. The 10-day moving average is currently below the 50-day MA, but it has stopped making lower lows the past few weeks,” according to Deron Wagner of Morpheus Trading Group.
XOP currently resides about 1.4% below its 50-day moving average and Wagner notes it is critical to the ETF’s fortunes to close above that line “as this would also result in a break of the daily downtrend line.”
XOP’s 52-week high s $73.76 and Wagner forecast that if the ETF can conquer that hurdle within the next few weeks, new all-time highs could be in play.
Although XOP has a 19.1% weight to refining and marketing names and a 5.7% to integrated oil and gas companies, the ETF has been one of the better performers in the oil patch this year because of its offers more pure exploration and production exposure relative to rival funds. [Chart of the Day: Oil ETFs]
Six refiners are found among XOP’s top-10 holdings, but the ETF is an equal-weight play where no holding receives a weight in excess of 1.97%. Lagging integrated names are found among XOP’s 75 holdings, but as just two examples, Exxon and Chevron combine for just 2.8% of the fund’s weight.
SPDR S&P Oil & Gas Exploration & Production ETF