Limping to the end of what has been a dismal year, gold futures and exchange traded funds backed by physical holdings of bullion could face more pain if key technical levels are violated.
Clinging to the $1,200 area during Monday’s Asian session after last week’s 2.5%, gold futures are in danger of seeing $1,180 an ounce sooner than later. The $1,180 an ounce area is viewed by gold traders and technical analysts as critical because, from there, things could get ugly in a hurry. [Trying to Find a Bottom for Gold]
“The break from $1,180 to $1,150 has the potential to be a 24-hour move. Low liquidity, major downtrend, important support. It really is all lining up for a potential massive move to the downside,” said Steven Dooley of Forex Capital Trading Pty. in an interview with Bloomberg.
Once the move below $1,180 occurs, gold will see $1,150 an ounce in short order and from there, the yellow metal will head toward $1,035, which was last traded in October 2009, Bloomberg reported.
For much of October 2009, the SPDR Gold Shares (NYSEArca: GLD), the largest gold ETF, traded in the $101-$103 area. GLD closed near $116 last Friday and is down nearly 29% this year. The Market Vectors Gold Miners ETF (NYSEArca: GDX) was more volatile in October 2009, trading in a range of just over $42 to over $48, either of which is more than double the ETF’s Friday close of $20.53. [A Bad 2014 Sequel for Gold ETFs]
Investors continue to pull assets from gold ETFs. “Assets in the 14 biggest exchange-traded products dropped 27.78 metric tons to 1,785.52 tons in the week ended Dec. 20, the most since the period to July 5. Holdings reached a record high of 2,632.52 tons on Dec. 20, 2012,” according to Bloomberg.
GLD and the iShares Gold Trust (NYSEArca: IAU) both rank among the 10 worst ETFs in terms of 2013 outflows.
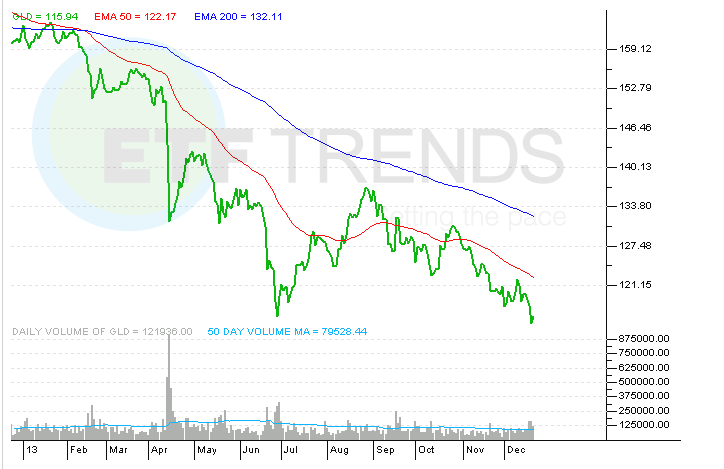
SPDR Gold Shares
ETF Trends editorial team contributed to this post. Tom Lydon’s clients own shares of GLD.