As the exchange traded funds industry has grown into a larger, more legitimate threat to mutual funds, comparisons are often made between specific ETFs and mutual funds. A worthy endeavor to be sure, particularly for investors that are new to ETFs.
S&P Capital IQ evaluated some ETFs and mutual funds from the largest S&P 500 sector, technology, in near head-to-head fashion. The research firm compared the Technology Select Sector SPDR Fund (NYSEArca: XLK), the largest technology ETF, and the Vanguard Information Technology Index ETF (NYSEArca: VGT) against the Fidelity Select Software and Computer Services Portfolio (FSCSX) and the T. Rowe Price Science & Technology Fund (PRSCX).
In terms of size, there is hardly any competition. Combined, the two mutual funds have $5.8 billion in assets under management, while XLK alone has $12.8 billion, making it the second-largest sector ETF in the U.S. [Sector ETFs: A Long-Term Perspective]
While all four funds have exposure to the likes of Google (NasdaqGM: GOOG) and Microsoft (NasdaqGM: MSFT), which both carry three-star ratings from S&P Capital IQ, the research firm notes the ETFs are purer plays on tech while the mutual funds carry some consumer discretionary and health care exposure.
In an effort to focus on ETFs that are pure technology plays, S&P Capital IQ excluded the PowerShares QQQ (NasdaqGS: QQQ) from its comparison against the aforementioned mutual funds. QQQ carries noticeable weights to discretionary and health care names and carries an overweight rating from S&P. [Nasdaq’s Evolution Could Bring New Highs]
Importantly, S&P Capital IQ notes that for the five-year period ending Dec. 6, the average return for FSCSX and PRSCX was about 500 basis points higher than it was for XLK and VGT. However, those higher returns came at a cost. FSCSX and PRSCX had turnover rates of 96% and 50%, respectively, compared to an average of 5.5% for XLK and VGT.
Due in part to those higher turnover rates, the mutual funds have average expenses of 0.85%, but the expense ratios on XLK and VGT are just 0.18% and 0.14% per year.
For investors looking to reduce volatility, the ETFs also come out on top. XLK and VGT have an average three-year standard deviation of 13.4% compared to 16.9% for the mutual funds, according to S&P Capital IQ.
The research firm has four-star ratings on Apple (NasdaqGM: AAPL) and Dow component International Business Machines (NYSE: IBM). Along with Google and Microsoft, those stocks combine for 40% of XLK’s weight. XLK and VGT are both rated overweight by S&P Capital IQ. [ETFs for 2013’s Top Tech Stocks]
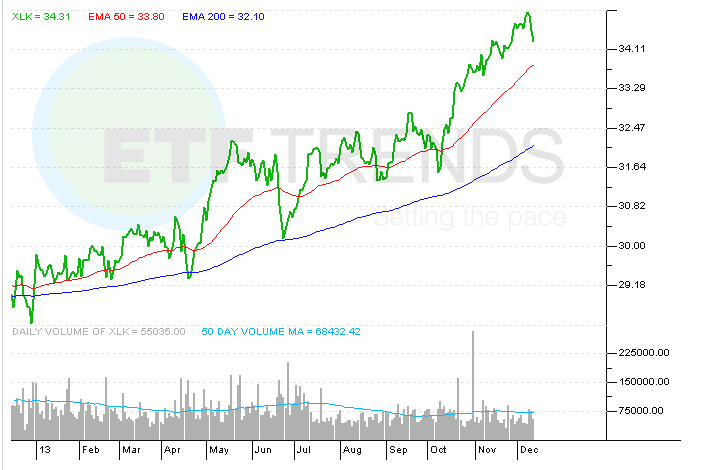
Technology Select Sector SPDR
Tom Lydon’s clients own shares of QQQ, Apple, Google and Microsoft.