The Demand For Storage
Source: “The Long and Short of Commodity Index Investing”, by J. Gunzberg and P. Kaplan, Intelligent Commodity Investing, edited by H. Till and J. Eagleeye 2007.
Simply put, there is a price consumers are willing to pay to have immediate access to a commodity during a shortage. As an example, a refiner is likely to pay a premium to have oil when there is a shortage so that its production of gas is not disrupted.
Storage can be used by both producers and consumers to fill gaps between production and sales, or between purchases and consumption. When a commodity is placed in storage to be delivered at a set time in the future at the futures price, then the opportunity to earn interest from selling the commodity in the spot market, then investing in a t-bill is lost. Also, one will pay the cost of the storage facility plus will gain (or lose) from the difference between the spot price and futures price.
Based on the above theory, two probable implications can be drawn about the effect of rising interest rates on commodities:
- Futures prices rise, and
- By storing, the opportunity cost is higher from the forgone interest so the incentive to store diminishes. Not only does the incentive to store diminish, but the rising rates may motivate investors to shift investments from commodities to yield-generating capital assets.
The second equation that demonstrates the direct impact of interest rates on commodity index returns is the total return (TR) calculation:
S&P GSCI TRd = S&P GSCI TRd-1* (1 + CDRd + TBRd)* (1 + TBRd)days
Where:
S&P GSCI TRd = the value of the S&P GSCI TR on any S&P GSCI Business Day, d
CDRd = the Contract Daily Return value represented as the percentage change in the Total Dollar Weight of the S&P GSCI on any S&P GSCI Business Day, d
TBRd= the Treasury Bill Return on any S&P GSCI Business Day, d =[1/(1-91/360*TBARd-1)1/91-1, where TBARd-1 = the 91-day discount rate for U.S. Treasury Bills, as reported by the U.S. Department of the Treasury’s Treasury Direct on the most recent of the weekly auction dates prior to such S&P GSCI Business Day, d.
days = the number of non S&P GSCI Business Days since the preceding S&P GSCI Business Day.
By definition, total return versions of commodity indices, such as the DJ-UBS CI and the S&P GSCI®, that incorporate the returns of the excess return (ER ) plus the Treasury Bill Return are positively impacted by rising interest rates which earn interest on the collateral of the futures contracts. Below is a chart showing the monthly return difference between the S&P GSCI TR and S&P GSCI ER:
S&P GSCI Total Return – S&P GSCI Excess Return
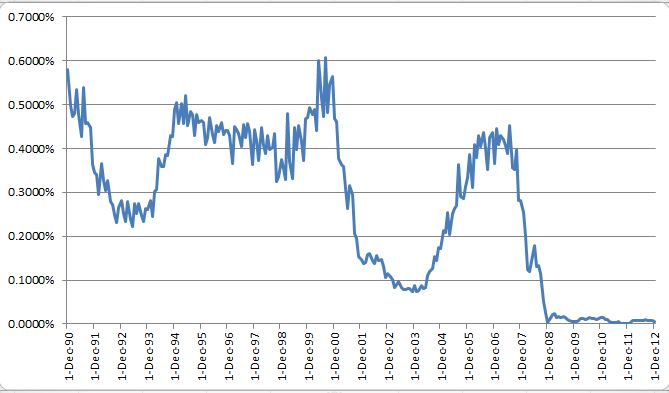
- Source: S&P Dow Jones Indices. Data from Dec 1990 to Dec 2012. Past performance is not an indication of future results. This chart reflects hypothetical historical performance. Please see the Performance Disclosure at the end of this document for more information regarding the inherent limitations associated with backtested performance
Since these indices are fully collateralized, this means that no leverage is used to gain exposure to the commodities through futures. As such, for every dollar of exposure, there is 100% cash in margin earning interest. The benefits are: the expected inflation plus real rate of return as well as an increase in the total return, by definition, as interest rates rise.