On October 31st we profiled the presence of put buyers in XOP (SPDR Oil & Gas Exploration & Production, Expense Ratio 0.35%) in this column with the ETF trading in the $70-$72 range, and we continue to see similar looking options flows in this ETF even as the sector craters lower.
XOP traded gigantic volume yesterday and fell through its 50 day Moving Average for the first time since August as bears continue to stalk the sector via puts. We saw some action yesterday in December 66 puts which are currently only slightly out of the money (to put things in perspective, when we first noted put activity in this ETF, they were 70 strike options which were out of the money, and this was inside of six trading sessions).
XOP is not alone here as there is clearly selling pressure in related Energy Equity ETF products, as OIH (Market Vectors Oil Services, Expense Ratio 0.35%) has seen some spillover as well, with the fund losing $150 million in assets via redemptions in recent sessions as well as seeing put activity in its options.
OIH is the third largest “Energy Equities” based ETF on the market currently, with about $1.66 billion in assets under management.
Furthermore, it is the largest “Oil Services” specific ETF on the market as well at this point in terms of AUM. Veterans of the ETF space likely think back to the “Merrill Lynch Oil HOLDRs” when they see or hear the ticker symbol OIH, but the fund as it stands today as marketed by Market Vectors is much different, and significantly modernized compared to the “old” OIH. Tracking the proprietary Market Vectors U.S. Listed Oil Services 25 Index, top holdings look like the following: (SLB 18.52%, HAL 8.42%, NOV 6.85%, BHI 5.02%, and FTI 4.87%).
The notable 18.57 % weighting towards one name, Schlumberger stands out here, and it should also be pointed out that this is a very specific sub-sector within the greater Energy Equity space, that being “Oil Services” names.
Despite the recent outflows in OIH, the fund has basically scratched for the year in terms of asset growth, losing only $6.5 million year to date. Other Oil Services specific ETFs that should be watched closely here include IEZ (iShares U.S. Oil Equipment & Services, Expense Ratio 0.48%), XES (SPDR S&P Oil & Gas Equipment & Services, Expense Ratio 0.35%), and PXJ (PowerShares Dynamic Oil & Gas Services Portfolio, Expense Ratio 0.60%).
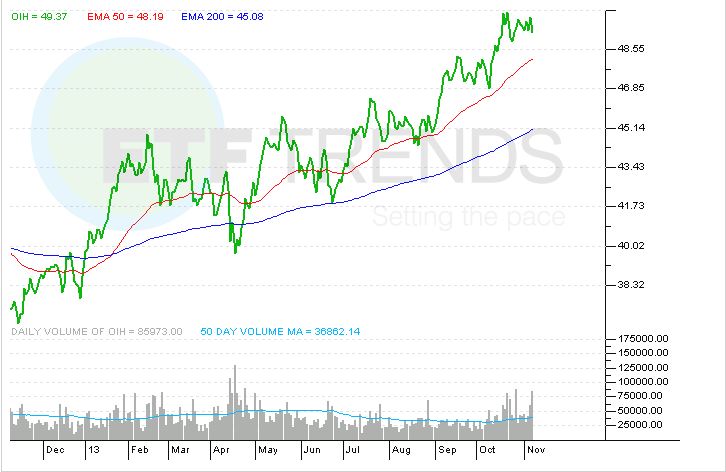
Market Vectors Oil Services ETF
For more information on Street One ETF research and ETF trade execution/liquidity services, contact Paul Weisbruch at pweisbruch@streetonefinancial.com.
Street One Financial is an educational/research firm utilizing the Broker Dealer services of GWM Group Inc (RLCC) a FINRA registered Broker/Dealer. All trades are executed through GWM Group (RLCC) and cleared by Fidelity (NFS)DTC number 0226. Street One Financial LLC makes available products and services offered by GWM Group Inc., a registered broker-dealer and Member Securities Investor Protection Corporation (SIPC), Investing in securities involves risks, and there is always the potential of losing money when you invest in securities.