A combination of two exchange traded funds can be quite useful for investors looking to exploit the market’s seasonal trends.
When it comes to U.S. stocks, data show the PowerShares DWA Momentum Portfolio (NYSEArca: PDP) and the PowerShares S&P 500 Low Volatility Portfolio (NYSEArca: SPLV) work well alone or as a pair for capturing seasonal trends.
As was reported earlier this month, Dorsey Wright & Associates back-tested the S&P 500 Low Volatility Index, SPLV’s index, for the 1997 through 2011 time frame, noting that it returned almost 87% in the November 1-April 30 period, also known as the best six months for stocks. [A Two-ETF Strategy for the Best Six Months]
On the other hand, PDP’s underlying index, the Dorsey Wright Technical Leaders Index jumped a staggering 465.5% in the best six-period from 1997 through 2011, according to Dorsey Wright data.
A similar approach can be taken to emerging markets with the PowerShares S&P Emerging Markets Low Volatility Portfolio (NYSEArca: EELV) and the PowerShares DWA Emerging Markets Momentum Portfolio (NYSEArca: PIE).
In this strategy, EELV replaces SPLV as the play for the worst six-month period for stocks (May-October) and PIE replaces PDP as the November-April play. “D uring the seasonally strong six months in the market, the Technical Leaders ETF has tended to provide greater returns than the performance of the Low Volatility ETF. This is consistent with what we have found within the US market study,” according to Dorsey Wright.
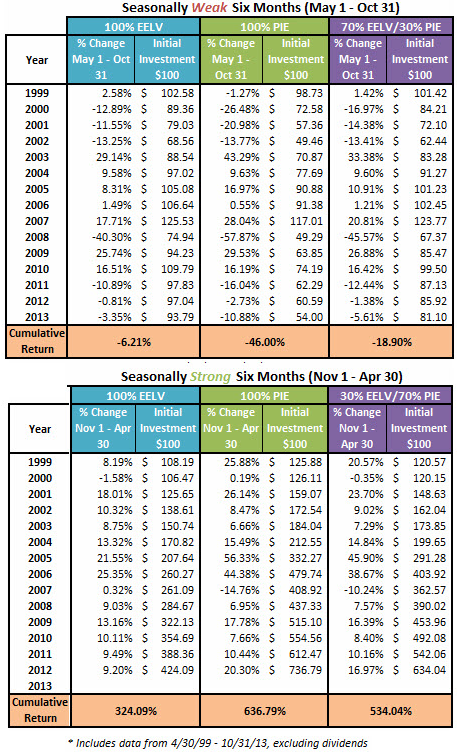
As was the case with the PDP/SPLV strategy, data provided by EELV and PIE are too compelling to ignore. A 100% allocation to EELV backtested to 1999 shows an average loss of 6.2% during the worst six-month period, but a 100% allocation to PIE was far worse with a 46% tumble. Allocating 70% to EELV and 30% to PIE resulted in a May-October loss of almost 19%.
EELV is something of an unsung hero among low volatility ETFs. The ETF has raked in almost $135 million of its $218.4 million in assets just this year. Heavy allocations to Taiwan, Malaysia and South Korea make the ETF a compelling choice in an environment where account surplus, low-beta emerging markets are prized by investors. [Emerging Markets Low Volatility ETFs]
PIE, which ranks its country weights by relative strength traits, was hit earlier this year due to large weights to Turkey, Thailand and other countries that proved vulnerable to Federal Reserve tapering speculation.
These days, PIE has taken a page from EELV’s book by offering significant exposure to account surplus countries as Taiwan, China and South Korea combine for over 42% of the fund’s weight. [PIE Slices: How This EM ETF Looks for Q4]
Not surprisingly, things look much different for EELV and PIE in the November-April time frame. EELV returned 324% dating back to 1999, but that is barely more than half what PIE returned, according to Dorsey Wright data.
EELV/PIE Best & Worst Six-Month Returns
Charts courtesy Dorsey Wright.