November is here and that means the start of the best six-month period in which to own stocks has also arrived.
Not all investors have subscribed to notion of seasonal investing, but that does not discount the strategy’s efficacy. Simply put, decades worth of data indicate there are better times of the year than others to own stocks. Just as important, there are sectors that outperform during those good times, so a tactical approach to strong seasonal trends is often warranted. [Materials ETFs Are November Buys]
For investors looking to use broader market ETFs to profit from the best six-month, there are myriad strategies to consider, including one for conservative investors that uses two large, familiar ETFs: The PowerShares S&P 500 Low Volatility Portfolio (NYSEArca: SPLV) and the PowerShares DWA Momentum Portfolio (NYSEArca: PDP). PDP recently topped $1 billion in assets under management. [Momentum ETF Tops $1B in AUM]
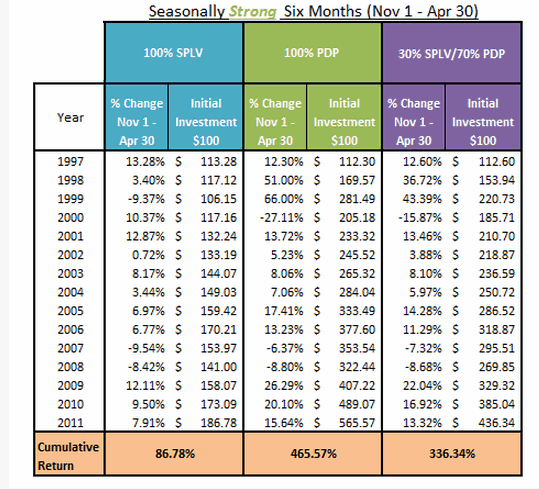
Dorsey Wright & Associates back-tested the S&P 500 Low Volatility Index, SPLV’s index, for the 1997 through 2011 time frame, noting that it returned almost 87% in the November 1-April 30 period, also known as the best six months for stocks.
On the other hand, PDP’s underlying index, the Dorsey Wright Technical Leaders Index jumped a staggering 465.5% in the best six-period from 1997 through 2011, according to Dorsey Wright data.
While PDP is a momentum play, it is tilted away from small-caps with a mid-cap bias. Mid-cap value and growth names combine for nearly two-thirds of PDP’s weight. Large-cap growth stocks command another 27%. Top-10 holdings include “momo” names like Apple (NasdaqGM: AAPL), Priceline (Nasdaq: PCLN) and Gilead Sciences (NasdaqGM: GILD).
Still, conservative investors may opt to mix to combine PDP and SPLV. That turns out to be a potent strategy as well when a portfolio is 30% allocated to SPLV and 70% allocated to PDP during the best six-month period. The 1997-2011 returns for that strategy were over 336%, according to Dorsey Wright.
“SPLV has generally provided greater returns during the seasonally weak six months (cumulative of 19.03% since 4/30/1997) than the PDP (-9.48%). However, the SPLV has notably lagged the return, up 86.78%, during the seasonally strong six months of the PDP, up 465.57%. Therefore, a 30% PDP/70% SPLV spit during the seasonally weak six months has seen a cumulative return of 13,37% while a 70% PDP/30% SPLV split during the seasonally strong six months has seen a return of 336.34%,” said Dorsey Wright.
As for the most recent efficacy of the buy PDP and SPLV during the best six months strategy, from November 1, 2012 through April 30, 2013, PDP surged almost 15% while SPLV jumped 16.3%. The S&P 500 was up 13% over the same time.
PDP/SPLV Switching Strategy (click to enlarge)
Chart Courtesy: Dorsey Wright & Associates