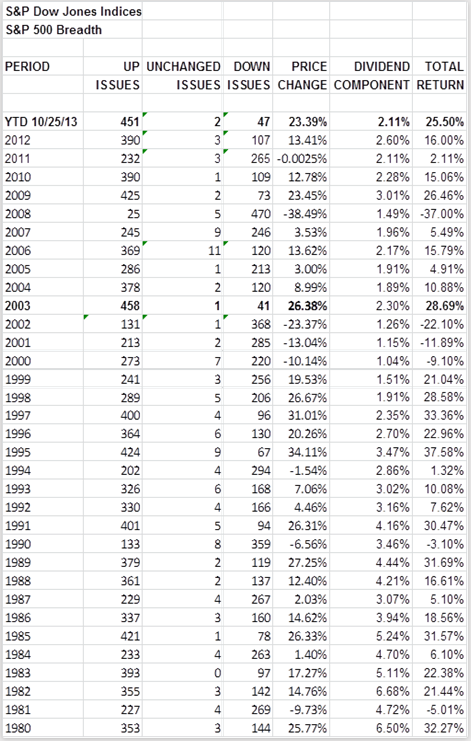
An overview of the market shows that breadth, the number of issues up compared to the number down, is running very strong this year. Year-to-date (YTD), 451 of the S&P 500 issues are up (47 down), which on an annual basis is the best since 458 issues increased in 2003. The 2003 number is also a record high from 1980, when my data series starts.
The number is significant since it shows the depth of the recovery. In the late 1990s, the market aggregates became dominated by technology, which grew on ‘faith’ and ‘hits’, as compared to sales and cash-flow. In 1998, the market returned 26.67%, yet only 57.8% of the issues were up, and in 1999, the market grew 19.53%, but less than half, 48.2% of the issues, were up.
For the 2013 YTD, 90.2% of the issues are higher, with the market aggregate up 23.39%; 270 issues are above that aggregate, with 140 issues up at least 40%. Surely, a significant number of people are seeing large gains, and surely, many are not, since they remain out of the market.
At the beginning of this year, when we did not fall off the financial cliff, investors poured billions into the market (the 1/2/2013 opening of 2.54% remains the best day since the 2.98% opening on 12/20/2011) – partially in relief, but also partially because frustration grew over not getting any return for their money after being out of the market in 2012 (the market was up 13.41%; 16% with dividends in 2012).
Chasing returns is not a good reason to invest, but when enough do it, the short-term impacts are more buying and higher prices- which we may be getting close to if the market stays anywhere near its current level. (FYI – Friday set two new official highs, an intraday of 1759.82, and a close of 1759.77)
Please note that the statistical data is based on publicly available information, most of which is available in S&P products such as Capital IQ, Compustat Research Insight and S&P Index Alert. Analysis and projections are my own, and may differ from others within S&P/McGrawHill. Nothing presented is intended to, or should be interpreted as, a buy/sell/hold recommendation.
My notes vary in topics, but are market related. The intent is to quickly inform. The assumption is that you don’t need a basic education, editorial or sales pitch, just specific facts and maybe some observations. If the information does not suit your needs, please e-mail me and I will take you off the list. Unless otherwise noted all data is for public dissemination, and may not be used for commercial purposes. Finally, any incoming correspondence from you will be considered confidential unless you specify otherwise.
About Howard Silverblatt
Howard Silverblatt is senior index analyst for S&P Dow Jones Indices. In addition to general market research and commentary, Howard is responsible for the statistical analysis of S&P Dow Jones Indices’ family of U.S. Indices, including the world’s most followed stock market index, the S&P 500®.