Oil futures traded in New York lost 1.75% last week and have traded lower in four consecutive weeks. Over the past month, the U.S. Oil Fund (NYSEArca: USO), which tracks oil futures, has tumbled 5.4%. The Energy Select Sector SPDR (NYSEArca: XLE), the largest equity-based energy ETF, is up a mere 0.4% over the same time.
However, not all oil ETFs that are comprised of stocks have recently been disappointments. Some have been defying oil’s slump. That list includes the iShares U.S. Oil & Gas Exploration & Production ETF (NYSEArca: IEO) and the SPDR S&P Oil & Gas Exploration & Production ETF (NYSEArca: XOP), both which hit new 52-week highs last Friday. [Time to get Into Energy ETFs?]
Over the past month, XOP is up 5.8% while IEO is higher by 3.4%. The pair’s out-performance of oil USO and broader energy funds such as XLE is not a phenomenon that started four weeks ago. Rather, it is a continuation of an ongoing trend. Year-to-date, both IEO and XOP are up 27.7%, better than two and a half times the gains offered by USO and 800 basis points ahead of XLE.
Thanks to soaring output at shale formations in North Dakota, Texas and other states, U.S. oil output is surging and that is proving to be good news for IEO and XOP, two ETFs that go about their business in noticeably different fashion. [Shale Revolution Boosts Energy ETFs]
For example, IEO’s 69 holdings had an average market value of $28.4 billion at the end of the second quarter, according to iShares data. The average market capitalization for XOP’s 75 holdings is $18.6 billion, indicating XOP has benefited from a deeper exposure to small- and mid-cap energy names. [Energy ETFs Outperforming in 2013]
Differences between the two ETFs also include IEO’s almost exclusive emphasis on exploration and production names while XOP has an almost 16% weight to refining stocks and a 5.5% weight to integrated oil names.
While the two have their differences, either can be integrated into the portfolios of risk tolerant investors. The average dividend yield for the two ETFs is just over 1%, a far cry from what investors are accustomed to receiving with an integrated oil stock like Chevron (NYSE: CVX). Considering risk-adjusted returns with an ETF like IEO or XOP is critical because both are more volatile than a broader energy ETF that is heavily allocated to mega-cap integrated names.
For example, IEO’s three-year standard deviation is 26.2% compared to 19.8% for the iShares U.S. Energy ETF (NYSEArca: IYE).
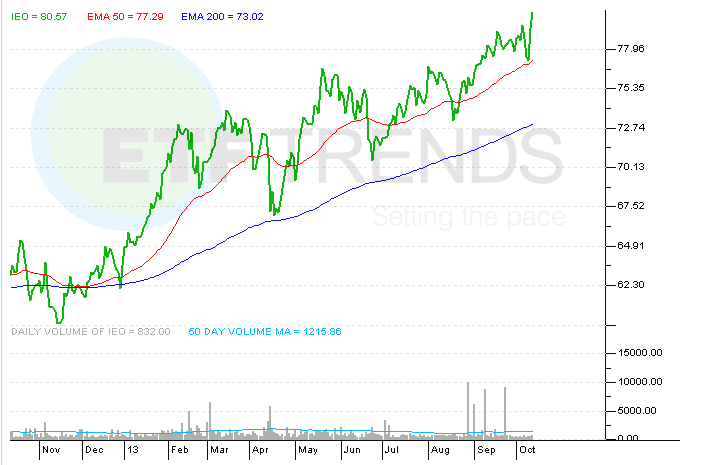
iShares U.S. Oil & Gas Exploration & Production ETF
ETF Trends editorial team contributed to this post. Tom Lydon’s clients own shares of IEO.