According to data from S&P Dow Jones Indices, preliminary results show that S&P 500 stock buybacks, or share repurchases, increased 18.1% to $118.1 billion during the second quarter of 2013, up from the $100 billion spent on share repurchases during the first quarter of 2013. Third-quarter data is not yet available.
Even without the third-quarter numbers, one thing is clear: Buyback ETFs are working this year. The PowerShares BuyBack Achievers Portfolio (NYSEArca: PKW) had a year-to-date gain of 31% at the end of the third quarter, making it the sixth-best market-based ETF this year, according to Dorsey Wright data.
The ETF has raked in over $1.3 billion in new assets this year, making it the second-best PowerShares ETF by that metric. Not only that, but PKW has a penchant for outpacing many of its underlying components and some of the largest share repurchasers that are not found in the NASDAQ Buyback Achievers Index. [Buyback ETF Topping Broader Market]
Howard Silverblatt, Senior Index Analyst at S&P Dow Jones Indices, noted a good chunk of the buyback activity is from Apple (NasdaqGM: AAPL), which spent $16 billion on share buybacks in the second quarter. But nonetheless, S&P Dow Jones Indices data show that for the 12-month period ending June 2013, S&P 500 companies increased their buyback expenditures by 4.7%, to $420.9 billion from the $402.0 billion posted in the prior 12-month period, according to a research note from S&P Capital IQ.
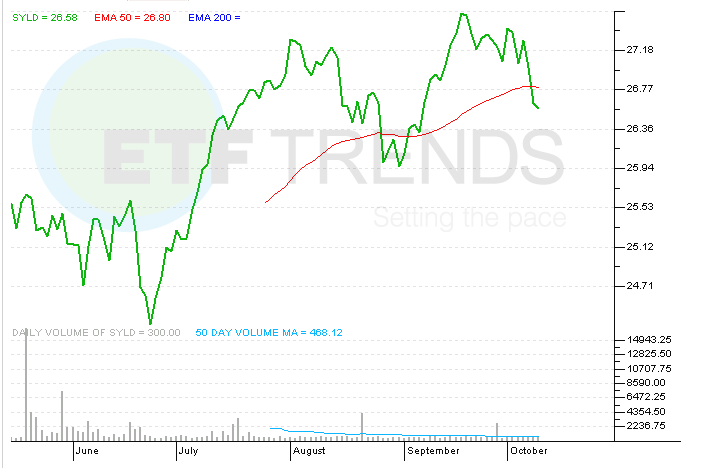
Apple is not a member of PKW’s almost 200-stock lineup. Nor is the iPad maker a dominant presence in the Cambira Shareholder Yield ETF (NYSEArca: SYLD). The newly minted, actively managed SYLD has gained 4% since its May debut and currently features a weight of just 0.91% to Apple. [Active ETFs Gain Momentum]
SYLD is off to a fast start with $125 million in assets under management, but the ETF focuses on more than just buybacks. “Specifically, SYLD invests in 100 stocks with market caps greater than $200 million that rank among the highest in (a) paying cash dividends, (b) engaging in net share repurchases, and (c) paying down debt on their balance sheets,” according to Cambria.
“Overall, companies continued to protect their earnings from dilution due to option execution with the actual share count slightly ticking down,” noted Silverblatt in the S&P Capital IQ note. “The data, however, show that there was a wide mix – 242 issues increasing their diluted share count compared to 225 issues reducing them. Significant changes (generally considered 1% or greater) favored reductions, as 90 issues reduced their count by at least 1%, with 58 issues increasing them at least 1%.”
S&P Capital IQ rates both ETFs marketweight. Although PKW is passively managed, SYLD is slightly cheaper with an expense ratio of 0.59% per year compared to 0.71% for PKW. The two share at least one thing in common: Large allocations to the consumer discretionary sector. That sector, which has been a prodigious raiser of dividends in recent years, accounts for 17% of SYLD and 34% of PKW.
Cambria Shareholder Yield ETF