Since my last post on the merits of using equities to balance the risk of rising rates, I’ve been asked well, what is the right mix of equities and fixed income?
Almost everyone’s top-of-mind answer is, of course, 60/40. It’s a portfolio that holds 60% equities and 40% bonds, and it’s widely used as a benchmark for numerous multi-asset or “balanced” allocation products. Financial professionals tend to use it as a reference point during portfolio allocation discussions with clients, and it’s widely quoted in the media.
So, does 60/40 hold up? I decided to sift through the numbers to see. What I found is that while, in general, a 60/40 portfolio may be a reasonable bet for long term investors, it might not always be the way to go for investors who hold strong convictions.
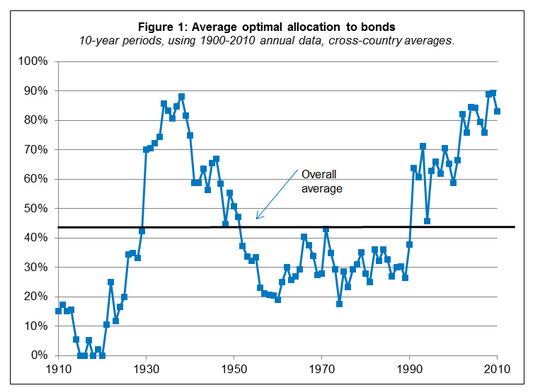
To come to this conclusion, I took equity and government bond returns from the DMS database, which includes annual return data for 19 countries since 1900. For each possible 10-year period in each country, I constructed the allocation that, over that particular 10-year period, would have delivered the best ratio of excess return to risk, aka the allocation with the best or “optimal” Sharpe ratio.
Figure 1 shows the average optimal bond allocation for each country, averaged across countries. Guess what? The overall average across countries and time is about 43% bonds (so, the remaining 57% would be in equities) — eerily close to the 60/40 rule.
But if you look beneath the surface of the overall average, however, what you find is a significant range of optimal choices depending on the broad time period. Over the most recent 20 years or so, we see a much lower equity mix than would have been optimal during, for example, the 60s, 70s and 80s.