The municipal bond market continues to be the subject of some pretty ugly headlines. But headlines, we know, rarely tell the whole story.
Pictures, on the other hand, paint a thousand words.
In my last blog, I tried to distinguish Detroit from the broader market.
In this post, I’d like to share a few graphs that really speak to the depth and diversity of the $3.7 trillion municipal bond market:
High Quality
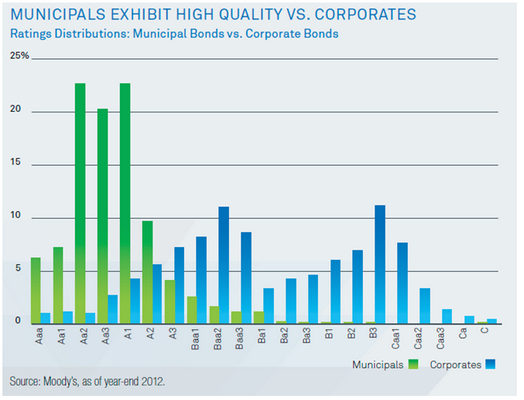
With an average rating of AA, the municipal bond market remains of high quality, particularly relative to the corporate bond market. Consider also that of the more than 7,500 municipal entities it rates, Moody’s assigns a below investment-grade rating to only 34. The agency has labeled Detroit non-investment-grade since 2009.
Default Remote
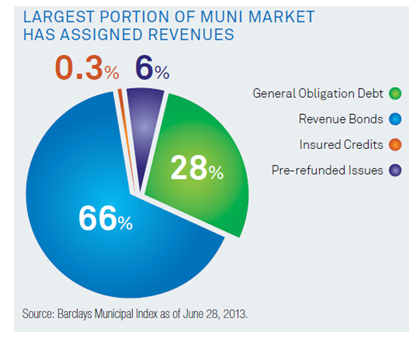
Roughly two-thirds (66%) of the municipal marketplace has assigned revenues that are an identifiable source of debt repayment – that is, they are supported by specific project revenues, rather than by a variety of unassigned tax sources as is the case with general obligation bonds. This reduces the likelihood of municipal bond defaults.
Isolated Areas of Vulnerability
To those who see distress in the muni market as rampant, we would offer the map below. Trouble spots exist, but we see many more areas of opportunity (note the blues and greens).
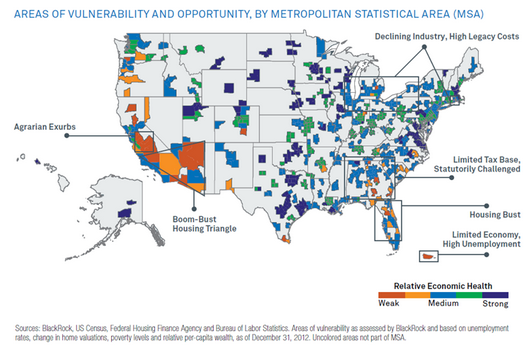
We think these images speak for themselves, and rise above the hubbub. Enough said … for now.
Peter Hayes, Managing Director, is head of BlackRock’s Municipal Bonds Group.