One of the most popular questions I’m getting from clients right now is how to position portfolios in the face of rising rates.
It’s not surprising given that long-term rates have spiked since the Fed’s now-famous tapering comments – 10-year Treasury rates have jumped almost 1.0% from a low of roughly 1.6% in early May to roughly 2.6% this week. Investors — suddenly faced with the potential of negative fixed income returns after a long bull bond market — are showing a renewed interest in equities as a potential rising rate hedge. But investors should look before they leap, since it’s not necessarily the case that equity and bond excess returns[1] can be expected to reliably move in opposite directions.
The statement above may be surprising to investors who have followed US markets in the past few years because recent data on the relationship between equity and bond excess returns seems to support the idea of equities acting as a hedge for bonds. Indeed, since the bottom of the crisis (i.e. the period March 2009 to April 2012) the correlation[2] between equity and bond excess returns was a negative 50% (which means equity and bond excess returns were moving in opposite directions, while there was a positive correlation between bond rate changes and equity returns). So, what gives?
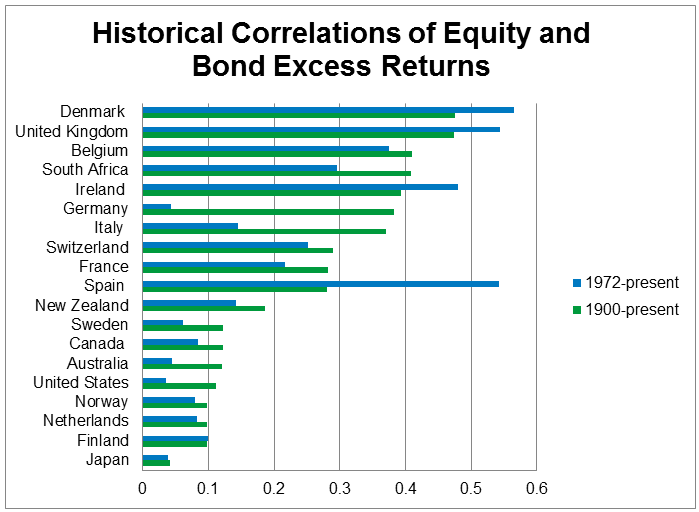
The answer is that this most recent period data isn’t the norm either historically for the United States or across other developed markets. To see this, I look at data collected by Dimson, Marsh and Staunton (generally referred to as the “DMS data”)[3], which contains annual returns for key assets across 20 countries from 1900-present. The breadth of this data provides a very broad view of what the “normal” behavior of returns looks like over the long run in large (mostly developed) markets.
Using this data the correlation of equity and bond excess returns across the entire sample is a positive 25%. If we look at a more recent period (since the breakup of the gold standard[4]), the correlation is still a positive 23%. And perhaps more importantly, there is no single country (see the chart below) where the correlation for equity and bond excess returns is negative either for the full period since 1900 or since the 1970s. In short, equities and bonds can diversify each other in the short term, but over the long run their excess returns do not reliably move in opposite directions.
So, should you avoid adding to your equity holdings if you’re concerned about rising rates? Not quite, since the larger average excess return of equities can dampen the impact of low or negative bond returns when rates rise. The upshot is that investors who are concerned about rising rates can benefit from a larger equity allocation as equities are diversifying to bonds and historically, their larger average return has provided an offset to poor bond returns when rates rise. Of course, there is no free lunch, as the potential cost of a larger equity position is that equities are riskier than bonds and thus a larger equity position is effectively a tradeoff between lower to the effect of rising rates at the cost of higher overall risk.
To illustrate the nature of this risk tradeoff, let’s use the DMS data and consider the 10-year period between 1972 and 1981, (from the breakup of the gold standard to the rate peak). Over this decade, short-term rates almost quadrupled from under 4% to close to 15%. A conservative portfolio composed of 70% bonds and 30% equities would have shown average annual excess returns of negative 2.5%, according to the DMS data. On the other hand, a portfolio with more aggressive positioning of 70% equities and 30% bonds would have shown average annual excess returns very close to zero, a better outcome by comparison. However, the DMS data shows the additional risk associated with the equity-heavy portfolio was significant. Given the annualized risk of over 20% for equities during that period, compared with about 7% for bonds, even after 10 years there was a reasonably high chance (1 in 4) of underperforming the bond-heavy portfolio notwithstanding the higher average excess returns from equities.
Daniel Morillo, PhD, is the iShares Head of Investment Research.
[1] The analysis in this post is done with returns measured in excess of the return associated with short-term bonds generally described as the “risk free” rate. This is because I have an interest in the tradeoff between taking bond risk (i.e. risk associated with holding longer-term bonds) and equity risk in order to obtain returns beyond what is possible via simply investing in short-term government securities.
[2] Data is from Bloomberg. Bond returns are computed as the return in the Barclays 7-10 year bond index minus the 1-month Treasury bill rate. Equity returns are computed as the returns of the S&P 500 total return index and the 1-month Treasury bill rate. Data on Treasury bill rates is from the standard H15 release from the FED.
[3] The DMS data is collected by Dimson, Marsh and Staunton as described in “101 years of global investment returns” (2002) and updated annually. For bond returns I use nominal long-term government bond (i.e. “treasuries”) total return for each country in excess of the nominal short-term bond return (i.e. the “risk-free” or “bill” rate) for that country. For equity returns we use nominal equity total returns in excess of the nominal short-term bill return.
[4] We have used 1972 as the first year of returns for this sample given that the U.S. exited the Bretton Woods system in August 1971.