Gold and silver are rising despite the spike in US bond yields and a stronger dollar.
The silver price rose 1.0% last week, bringing gains over the past 8 weeks to 27%. The gold price also rose, bringing the total increase to 14% since its 5 July low.
While the spike in US bond yields is pressuring many financial assets, precious metals took the latest release of the Fed’s FOMC minutes in stride, ignoring the Fed’s statement that it is “broadly comfortable” with moving ahead with reductions in bond buying in the near future. The fact that both gold and silver prices ended the week higher indicates that the start of Fed tapering has largely been priced in to precious metals prices. [Silver ETFs Getting Help from Speculators]
U.S. 10yr yields and the gold price are now trading more or less around the same levels they were in November of 2010, when QEII was first announced. The 2013 correction in precious metals prices has attracted substantial physical demand, notably strategic buying by China. This demand surge, combined with a sharp decline in recycled gold supply and diminishing mining productivity, appears to be forming a solid foundation for the gold price.
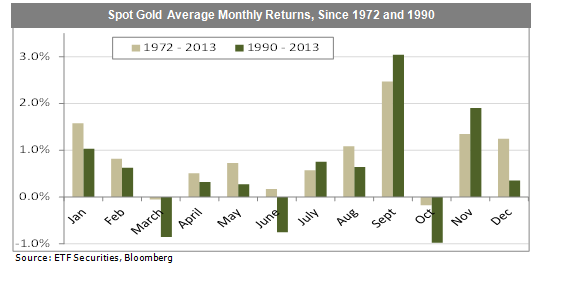
September – the best month for gold. September has historically been the best month for gold investors (see chart below). Notably due to buying in advance of the Diwali festival in India, since 1990 the gold price on average has gained about 3% in the month of September (+2.5% if measured since 1972).
Another record demand indicator – silver ETF holdings reach a new high. Demand records continue to accumulate, including: an unprecedented period of negative gold swap and forward rates, the longest period of gold futures backwardation in history, record physical gold demand from China, record US Mint silver coin sales and most recently, a new record high in total silver ETF holdings. Total silver ETF holdings reached a record of 644Mn ounces as of August 21, representing about 83% of 2012 total mine supply. According to the World Gold Councils’ latest quarterly report, net gold demand from India and China in 2013 is likely to exceed 30mn ounces, respectively, representing a new high from China. Putting this in context, total gold mining supply in 2012 was about 87mn ounces, thus India and China demand alone is expected to equal nearly 70% of total annual mine supply. Despite increased restrictions on India’s gold and silver imports and a new historic low value for the Rupee, Indian demand is expected to remain robust.
Increasing global GDP improves underlying support for PGMs. In the latest sign of improving global economic conditions, stronger than expected Chinese manufacturing data helped to support industrial-intensive platinum and palladium prices. Recent Chinese platinum import data indicated a YOY increase of 20%. Chinese jewellery demand is the single largest category of platinum demand, just ahead of European auto catalyst demand. Europe appears to have exited the longest recession in post WWII history, which should help sustain platinum prices above the recently breached US$1,500/oz. level.